Who is Buying Stocks Today?
Movements in the stock market are caused by imbalances between supply and demand. When those desiring to purchase stocks exceed those looking to sell, the excess demand is met by bidding prices up, therefore, inducing more holders of stocks to sell. And of course the opposite is true when sellers exceed buyers, forcing a drop in prices. The scope of the imbalance affects the distance the price must move to achieve equilibrium.
In equilibrium, every issued security is held by someone. For every buyer there is a seller and vice versa. One of the most misconceived notions is that selling stocks creates "money on the sidelines". No additional cash is created from the purchase and sale of a stock in the secondary market. The cash merely changes from one person to another.
In my July 21
Weekly Market Update, I included
investment legend and former Chief Market Analyst at Merrill Lynch, Bob Farrell's, 10 Market Rules to Remember. The focus of the newsletter was the lack of breadth in the market, as I emphasized Rule #7:
- Markets are strongest when they are broad and weakest when they narrow to a handful of blue-chip names.
As bubbles expand towards their peak, stock indices are typically driven by fewer stocks, those reflecting the "trend of the day". At first, these stocks are pushed higher by institutional money. As prices inch towards the edge of the cliff, the institutional or "smart" money exits about the time the retail investor is piling in, resulting in the "little guy" getting hit the hardest when the market corrects.
The movements today are exacerbated by the high frequency traders (HFT) and algorithmic or program traders. These tend to comprise the majority of daily trading volume, even if they only hold their securities for a nano-second.
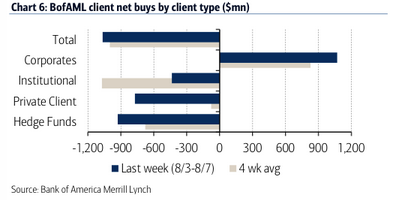
Recently, as seen in the graph below prepared by Bank of America Merrill Lynch, the downtrend includes the big guys, as well as the private client.
This was also confirmed in an article on CNBC stating:
"The flight of investor money from U.S. stocks has turned into a stampede.
In fact, the $78.7 billion leaving domestic equity-focused funds has been worse in 2015 than it was even during the financial crisis years, when the S&P 500 tumbled some 60 percent, according to data released Friday by Morningstar. The total is the highest since 1993.
Domestic equity funds surrendered $20.4 billion in July alone and have seen $158.6 billion in redemptions over the past 12 months. Even a strong flow of money into passively managed exchange-traded funds has been unable to offset the stream to the exit among retail investors, who generally focus more on mutual funds than ETFs."
And Zero Hedge highlighted the flight utilizing the Bloomberg Smart Money Flow index as seen in the chart below:
But wait, if both the smart money and the retail money is selling, who is buying? In equilibrium somebody has to be the buyer. Bank of America Merrill Lynch answered the question in the graph below:
The buyers pushing stock prices higher are corporations executing stock buybacks. Common sense would say that companies should buy their stock when the price is low and sell when the prices are high. Yet companies today are borrowing hand-over-fist to buy their stock back at record high prices. The following excerpt is from economist and fund manager, John Hussman's Weekly Market Comment:
"See, the timing of buybacks at an aggregate level has nothing to do with value. As Albert Edwards at SocGen has often observed, not only do buybacks increase at rich market valuations and dry up in depressed markets, they are also typically financed by issuing debt. What drives buyback activity is not value, but the availability of cheap, speculative capital at points in the business cycle where profit margins are temporarily elevated and make the increased debt burden seem easy to handle."
The problems arise when profit margins normalize and earnings dwindle, but the debt remains. We appear to be in the Land of Oz as we stroll down the yellow brick road where common sense has given way to fantasy. Central banks create trillions of dollars from thin air to fund government debt. Debt is used to solve problems created by too much debt. Corporations borrow billions to retire capital, so they can inflate earnings on a per share basis and boost executive stock compensation. In the "good ole days" companies would issue stock to raise funds to pay-off debt and invest in productive assets. Today, corporate debt is used to create the illusion of profitability. Something that will come back to haunt them if sales continue to fall and expenses can no longer be cut.
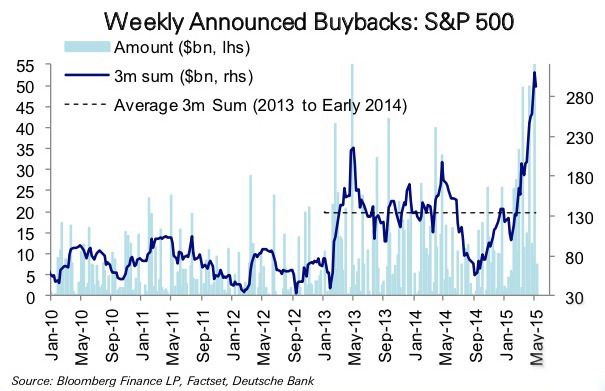
Corporations are now the major leveraged purchaser of stocks. See the graph below from Hussman's Weekly Market Comment:
Last Tuesday the S&P 500 closed at 2,084. As soon as the market opened Wednesday morning, stocks began to plummet. The S&P 500 fell 32 points or just over 1.5% by late morning. Then, out of nowhere and on no apparent news, stocks took-off and recovered the entire loss. Many were shaking their heads wondering who "saved" the market. The following from Bloomberg, via Zero Hedge, attempts to answer that question:
"Who did the buying as U.S. stocks staged the biggest turnaround in three years? The companies that issued them.
The Goldman Sachs Group Inc. unit that executes share buybacks for clients had its busiest day since 2011 on Wednesday, according to a note from the firm's corporate agency desk. Based on the value of equities repurchased, volume handled by the bank set a record. The note was confirmed by spokeswoman Tiffany Galvin.
Corporations have emerged as one of the biggest sources of fresh cash in the stock market, eclipsing even mutual funds with more than half a trillion dollars spent last year, according to data compiled by S&P Dow Jones Indices. They swooped in and bought again on Wednesday as the Standard & Poor's 500 Index flirted with its largest two-day selloff since January."
Lately, surges such as this have been on low volume and weak breadth. Bob Farrell's Rule # 7 states this is not indicative of a strong market. Our thoughts are that with slowing global GDP, and falling corporate revenues and profits, it will take more than corporate buybacks to expand this bubble much further before it pops. The economic data is exposing a weakening environment. Under these conditions, it should be harder to re-convince the smart money or even the retail investor to jump in with enough conviction to sustain the bubble much further.
The S&P 500 Index closed at 2,092, up 0.67%. The yield on the 10 year Treasury note rose to 2.20%. Oil prices fell to $43 per barrel and the national average price of gasoline according to AAA rose to 2.67 per gallon.