|
Does the Current Market Have Bad Breadth?
No, I am not talking about something that can be fixed with a Certs. Market breadth refers to the number of stocks advancing versus declining. Is the market rising due to the movement of a few stocks in the index or because of a broad-based upswing?
Over the years I have shared investment legend and former Chief Market Analyst at Merrill Lynch, Bob Farrell's, 10 Market Rules to Remember. It now might be apropos to revisit them, paying particular attention to #7:
- Markets tend to return to the mean over time.
- Excesses in one direction will lead to an opposite excess in the other direction.
- There are no new eras - excesses are never permanent.
- Exponential rapidly rising or falling markets usually go further than you think, but they do not correct by going sideways.
- The public buys the most at the top and the least at the bottom.
- Fear and greed are stronger than long-term resolve.
- Markets are strongest when they are broad and weakest when they narrow to a handful of blue-chip names.
- Bear markets have three stages - sharp down, reflexive rebound and a drawn-out fundamental downtrend.
- When all the experts and forecasts agree - something else is going to happen.
- Bull markets are more fun than bear markets.
Recent stock market action was accurately described by fund manager and economist, John Hussman, in his Weekly Market Comment, as follows:
"Last week was a rather exasperating exercise in two-tiered markets; a type of divergence between the broad market and a handful of glamourous 'concept' stocks that has often marked the wildest and most joyous points of reckless abandon in the market cycle, at least for speculators not tethered by traditional measures of value or historical experience. I'll spare the list of names, which should be obvious to investors by their confetti."
The expansion of almost every mature bubble is led by a few large, trendy names. Recently, the names have been housed in the technology camp. When the manic phase of the stock market cycle is reached, it doesn't matter if earnings are present, as the "anticipated growth" of the company renders current earnings inconsequential. This is also the time when the mainstream financial media hype endorses these actions luring even the most staunch value investors into capitulating and joining the crowd (see #5 above).
It has been said that "history does not repeat itself, but it rhymes" (some ascribe this quote to Mark Twain). The question is do we believe that history is relevant? Are there lessons to be learned? Does it matter that in every prior bubble prolonged by "glamour" stocks, exorbitant losses ensued with the next correction?
As written by Hussman, "In the advance leading to the 1929 peak, the darlings included AT&T, Bethlehem Steel, General Electric, Montgomery Ward, National Cash Register, and Radio Corporation of America - companies that embraced the expanding world of department stores, communication, and industry. Those stocks would lose an average of 93% of their value by 1932.
In the late-1960's, the glamour stocks were instead focused on rapid growth; '-onics' and 'tronics' stocks, as well as conglomerates that grew mainly through acquisitions. In 1972, the focus turned back to blue chips - the 'one decision' Nifty Fifty stocks that investors believed could be held forever because of their promising growth. Many of these stocks did indeed turn out to enjoy tremendous earnings and revenue growth over the following decades, but that didn't prevent deep losses in the interim."
The 1990's ushered in the dot-com era. Technology and tech-related stocks saw prices and valuations skyrocket, many with no earnings to report. The names still ring a bell, Cisco Systems, Sun Microsystems, EMC, Juniper Networks, among others. Most of these "leaders" lost close to 92% of their value before the cycle ended.
The current central bank inspired bubble has gotten quite long in the tooth, so it is time for the low breadth lift-off provided by a minority of "net-related" stocks. Take Netflix for example. Despite leading analysts to slash earnings expectations, the stock soared, now exhibiting a price/earnings (P/E) ratio well over 300. I expect this too will rhyme with the historical 92% precedent.
We are currently in the middle of the quarterly Wall Street earnings game. The game is played as follows: prior to announcing their earnings, corporations inform the analysts that they have dropped their expectations. The analysts' in-turn revise their "expectations" accordingly. Then, when corporations' report earnings they are typically slightly higher than the analysts revised number, but extremely lower than the pre-revision number. This is then tallied as a "beat" and Wall Street can break out the confetti and celebrate. This game was played by Netflix as they "beat" expectations by 2 cents. After drastically dropping expectations (originally around 32 cents per share) to 4 cents per share, actual net earnings came in at 6 cents/share, sending the stock soaring to a P/E of near 350. A beat of 2 cents, although 26 cents below pre-revision expectation...time to celebrate?
Since, as famously proclaimed by economists and CNBC star Larry Kudlow, "earnings are the mother's milk of stocks", should it matter that according to the S&P website, year-over-year, quarterly earnings are expected to decline for the third quarter in a row? Or that the second quarter YOY quarterly drop in earnings is projected at about 7%?
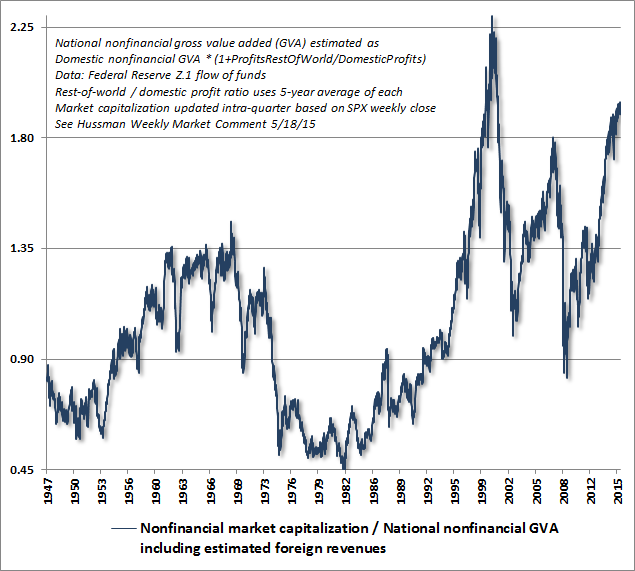
Valuations are now the second highest in the history of the stock market by many measures. As Hussman states, "As a reminder of where the market stands at the moment, the chart below shows the ratio of nonfinancial market capitalization to corporate gross value added. While other historically reliable metrics carry a very similar message, Market Cap/GVA has the highest correlation with actual subsequent 10-year S&P 500 total returns than any other valuation ratio we've examined across history."
Let's summarize: valuations nearing all-time highs, and the current advance relying on the "glamour" stocks of the day - at least one with a P/E over 300; deterioration in market "internals" including credit spreads, and supply and demand measures; and, falling earnings. Now would be a good time to re-read Bob Farrell's 10 rules above.
The market currently has bad breadth. Combined with the other warnings, it might be appropriate to re-examine the damage done to portfolios during prior market corrections. I will delve into this further in a subsequent Weekly Market Update, but as Hussman stated, "a 50% market loss converts a 200% market gain into a 50% market gain." It sounds strange, but that's how the math works. He continues, "Our actual expectation is that the completion of the current market cycle is likely to wipe out the entire total return of the S&P 500 - in excess of Treasury bill returns - all the way back to roughly October 1997; an outcome that would require a market retreat no larger than it experienced in the past two cycles, and that would not even carry historically reliable valuation measures to materially undervalued levels."
After another volatile week, the S&P 500 Index closed at 2,127, up about 2%. The yield on the 10 year Treasury note fell to 2.35%. Oil prices fell to $51 per barrel and the national average price of gasoline according to AAA dropped to 2.76 per gallon.
| 


