In the past thirty years or so of my commercial grain analysis, clients have caught many mistakes, indeed too numerous to mention. Such is the case with
China Note #3, in which the population totals for China in 1990 and 2016 were incorrect as cited in the table--a case of a "bad link" from my Overview sheet to my underlying UN Population file.
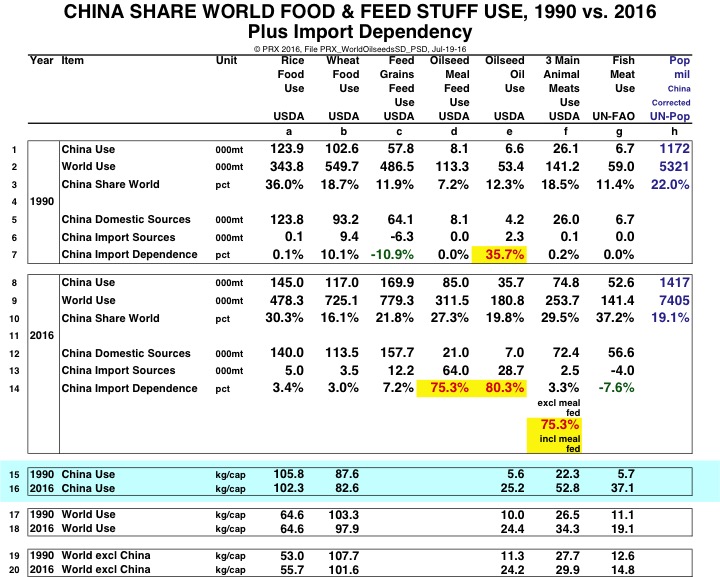
The correct numbers are shown in the repeated table below. All of the tonnage data from USDA's official PSD files are correct as previously presented, and the calculated inferences about the percent "import dependencies" of China by food class are unchanged and (thought to be) correct. In the new table below, I have begun to list some per capita data on the food classes, but we'll come to that in a moment, and present important details on subsequent Notes.
Hudson's Law for Spreadsheets. Show me a linked Excel file of several megabytes that has no errors, and I will show you a miracle. It is not possible not to make errors, and it is not possible to "vet" your sheets with colleagues and expect them to find all your mistakes. This goes for commercial researchers, academics (even big "collaboratories"), and teams of government regulators. PRX found two such errors in the last EPA Proposed RFS Rule, which were corrected in the Final. "Obvious things," like not adopting 29 days for February in a leap year.
Hudson's (Proposed) Law for Big Models. The problem is not only with incorrect arithmetic and linkages being constantly updated by many official sources, but also the changing "logic" of the formulas you choose to use in your sheets, the so-called algorithms or syllogisms. Big Modelers seem unduly confident that they "know how the market works," that they can statistically identify and connect so-called independent variables with their necessary dependent variables, construct the formulaic logic of the connection, and forecast future numerical results.
But this series of China Notes started with an argument that the "rise of China" was most likely one of a kind, an episode in history with no precedent. For instance, looking at the per capita data in lines 15 and 16 below, we see that China's per capita use of rice and wheat between 1990 and 2016 is fairly stable, but that China's per capita use of the three main meats (pork, beef, and poultry) has more than doubled in the same period, and that its per capita use of vegetable oil has nearly quintupled! This fits well with the dramatic rate of urbanization we've already charted.
The formal process for pretending that such an historical episode as the rise of China can be quantitatively modeled in a meaningful way is known as the "counterfactual approach." My law for this in the commercial arena is that this is illegal; it will not produce strategic thinking that is competitive. Governments, of course, can and will use such deficient approaches ("the best available science") to construct and execute legislative rules--but in my view this is part of "why Washington doesn't work."
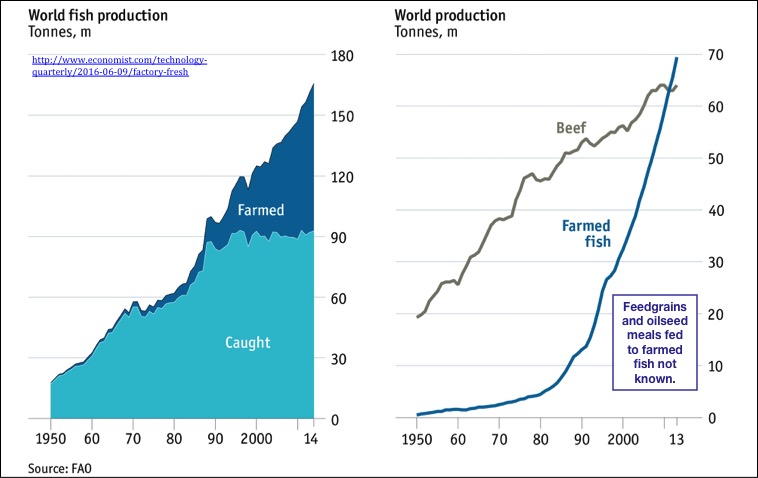
Aquaculture, another Critical Development. In column g below, I give a preliminary estimate of per capita use of fish food in China and the world. This is real guesswork. The UN-FAO database is enormously complex, with dozens of species and dozens of fishing regions--caught and/or "produced." We have no good data as yet on how much grains and oilseeds goes into "fish farming," but you can tell from the chart below that the volume is likely to be important, let's say especially in the South China Sea!
Let the User Beware. The PRX Blue Sky Model is unabashedly non-academic. Our staff and our client family are seen as a kind of "team," experienced and savvy about commercial agriculture. But for our own part, we do not advocate either "necessary trends" or "appropriate government policies"--we present the details and critique the likely results and implications.
Join us August 18-19, and get the big picture firsthand!
Early bird registration is here. View the agenda here.