In the previous analysis, we showed that meat usage for the world in 2016 was 253.6 million metric tons, carcass weight--with 36.7 mmt in the US, 74.7 in China, and 142.2 mmt in the Rest of the World. Here let us combine the 74.7 mmt + 142.2 mmt = 216.9 mmt, and let us undertake to determine also from USDA data how much trade in corn and soybeans this represents, and what the annual trend increase is in US and world trade of these two key commodities.
The table below shows the data and method used in this straightforward calculation. Let me emphasize that this is not by any means "sophisticated modeling." I generally oppose such approaches for commercial strategic forecasting, because (1) they have negligible skill, and (2) they obscure the concepts we are trying to grasp for our intellectual and business benefit. It is not possible for most commercial people to grasp "what's going on inside the big academic and institutional models--such as what variables are driving the bus."
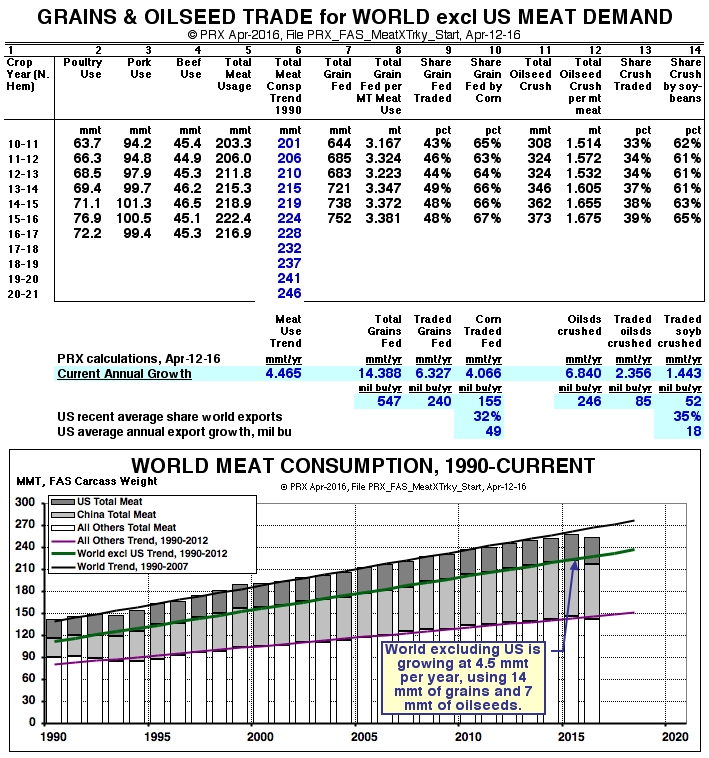
Column 5 in the table shows the 216.9 mmt of meat consumption in the World excluding the US in 2016, and column 6 shows the straight-line trend in this volume for 1990 to 2014, growing at an annual rate of 4.465 mmt per year. Column 5 of actuals is below the trend slightly in 2015 and moreso in 2016. We will nonetheless use the 1990-2014 trend because of its good historical fit, as shown in the chart. It's too soon to decide we should lower the entire trend, because of what we know are possibly "glitches" in China pork usage.
Column 7 gives USDA figures for the Total Grains Fed in the World excluding the US, and column 8 is simply the tons of Total Grains fed per ton of Total Meat Usage. Column 9 is the share of such grain fed furnished via trade, and column 10 the share of the grain fed by corn furnished by trade. Columns 11 through 14 show the same data and approach to arrive at soybeans furnished by trade and crushed for meal to be fed.
Below the table, highlighted in blue are the annual growth numbers for columns 8 to 10 and 12 to 14, in metric tons per year--and finally the conversion of the metrics to millions of bushels per year. Thus we calculate that meat demand outside the United States accounts for trade of about 155 million bushels of corn each years and 52 million bushels of soybeans.
Importantly, in the face of competition (principally from South America and the Black Sea), the present US growth of exports is only 32% x 155 = 49 million bushels per year of corn, and only 36% x 52 = 18 million bushels per year of soybeans.
Question. If these estimates are realistic, can we expect the growth in meat consumption outside the US to furnish enough new demand each year in the future to match the growth of our corn-soybean agriculture on the supply side?
Reference. If the US harvests about 83 million acres of corn each year with a growth in the technological trend yield of 1.70 bushels/year, this would mean 140 million bushels more corn production each year (given normal weather). Likewise, harvesting 83 million acres of soybeans with a trend yield gain of 0.79 bushels/year would mean 65 million bushels more soybeans each year.
Tentative Answer. Either the productive capacity of the US corn-soybean sector must compete more successfully for the coming growth in world meat consumption, or the sector must find market demand outside meat--such as industrial and fuel use.
The next essay in this series leading up to our
May 18 Roundtable will focus on competition, and then we'll turn to the potential of world industrial and fuel markets.