Data Center Logo
End of Summer 2013                                                                                                                                         
Mike w Neuhart


Quick Links  


June 2013 Data Center Newsletter

May 2013 Data Center Newsletter


Save  
the Dates
~

2014 Demography  

Conference  


Tues-Thursday,  

June 10-12, 2014.  


On the campus of South Dakota  

State University.


Census Blog
I've been looking at the Census Blog (http://censusprojectblog.org/).  It's not one of the blogs that takes a lot of time - Lowenthal only posts one article per week, so she's not hard to keep up with.  Recent weeks have been describing Canada's equivalent of the American Community Survey, and the challenges they face in data collection when a mandatory survey is replaced with a voluntary one.  They dropped from a 94 percent response rate to a 68% response rate.  On the other hand, our northern neighbors moved to a net-based response to their Census back in 2006, and in 2011 wound up with 60%.  It doesn't take a lot of time to keep up with this blog.


Mike McCurry, Ph.D.
 Data from the IRS 

There were 732,691 tax returns from South Dakota filed with the IRS for fiscal year 2012.  I learned that from an 84 page document titled "IRS Data Book 2012."  It's kind of a catchy name, considering all the press the IRS has been getting lately.  It doesn't have the scandal data - just information about IRS data . . . for example, 426,011 of those South Dakota returns were filed electronically, and South Dakota filings totaled $5,136,249,000.  By my rough math, that's about $6,300 for every man, woman and child.  As always, don't take my word for it - you can download the report at http://www.irs.gov/pub/irs-soi/12databk.pdf.  It's surprising how much demographic information we can get from the IRS.

  Mike McCurry, Ph.D.

Linking OnTheMap for Emergencies


OnTheMap for emergency management.  A few more features have been added to OnTheMap, the Census' map-based interface.  You can get to the emergency management side by clicking this link: http://onthemap.ces.census.gov/em.html.  Instead of taking you to the population and employment data you already know about, this link will provide information about wildfires, flooding, tornadoes and declared disasters.  With the new interface to TIGER 2012, this link should be improving quickly.


Mike McCurry, Ph.D.

Women in Agriculture
In April, the USDA released "Characteristics of Women Farm Operators and Their Farms" - a 51 page document that is going to reduce the workload in the data center (or more realistically, just give us time to answer different questions). female farmer
   

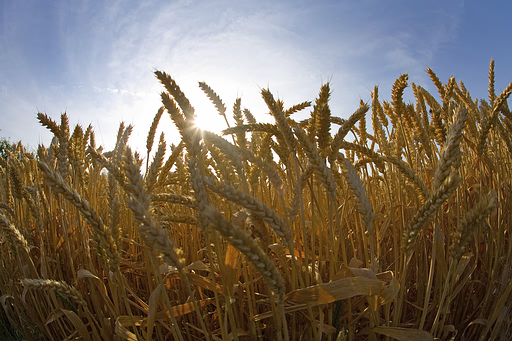
We've been answering individual questions about women and farming as they come in, but this bulletin provides a fast reference, with much of the research already completed.  For example, the median age for a woman principal operator is 59 - but that age has been stable as the hypothetical median male principal operator has been aging fairly rapidly.  Woman operators have more formal education than their male counterparts.  The nation has gone from 5 percent of the farms having women operators (1978) to 14 percent (2007).  If you want the report, it's online at http://www.ers.usda.gov/media/1093194/eib111.pdf 

  Mike McCurry, Ph.D.

Computers: A sign of the times


The Census has released "Computer and Internet Use in the United States" http://www.census.gov/prod/2013pubs/p20-569.pdf .  It's kind of a sign of the times - the lowest age of the user cohorts is three.  South Dakota showed only 13.9 percent of the population without computer access and 27 percent having no internet connection anywhere - the best connected state, at 20.30 percent unconnected was  Washington.    

Mike McCurry, Ph.D.  
* * * * * * * * * * * * * * * * * * * * * * * * * * * * * * * * * * * * * * * * * * * * * * * *
Trends in Births and Fertility
* * * * * * * * * * * * * * * * * * * * * * * * * * * * * * * * * * * * * * * * * * * * * * * * 

The National Center for Health Statistics has released Recent Trends in Births and Fertility Rates Through December 2012, available at http://www.cdc.gov/nchs/data/hestat/births_fertility_december_2012/Births_Fertility_December_2012.pdf.  It's probably not a great surprise, but the US birthrate has dropped from 69.3 (births per thousand women aged 15 to 44) in 2007 to 63.2.  It's a short paper, so it won't take long to maintain the habit of checking what people tell you.

Mike McCurry, Ph.D.

Poverty Level Map    

An interesting Census Application is available at http://calvinmetcalf.github.io/CodeForBoston-Census/#6/43.101/-104.194 .  Clicking on the link brings up a map with county level poverty data from the American Community Survey available with a single click on the county.  First the internet made demography a science for people distant from universities and libraries.  This app seems to be making literacy optional for beginning demographers.  I'm not sure that it's a bad thing for people to learn the percentage of a county's population that lives in poverty before they learn to read "See Jane run" but others may disagree with me.  A second version is available on the cloud at http://data-otp.rhcloud.com/Below-Poverty-Line#5/39.555/-91.187.


Mike McCurry, Ph.D.

Foreign
Born
Labor

The Bureau of Labor Statistics has recently released "FOREIGN-BORN WORKERS: LABOR FORCE CHARACTERISTICS - 2012."  One of the highlights was "In 2012, there were 25.0 million foreign-born persons in the U.S.labor force, comprising 16.1 percent of the total."  Almost half of the foreign-born workforce is Hispanic, and nearly a quarter Asian. "The labor force participation rate was 78.5 percent for foreign-born men and 68.6 percent for native-born men."  To look at the whole report, click http://www.bls.gov/news.release/forbrn.nr0.htm 

Mike McCurry, Ph.D.

The SDSU State Data Center is in the process of expanding! For those used to visiting us in Scobey Hall, we are still here, but at the other end of the hall. We are now occupying Scobey Hall 230, 232 and 234! With this change we hope to be more efficient and helpful. Come visit if you have a chance! We are still getting organized but it is looking better every day.
 

Planning for the  

next Demography  

Conference  


We've had some time now to review how we did at our first Demography Conference and we're upbeat. When we passed 32 pre-registrations, we had to grab a second  computer lab to be able to include all 44  participants. That created a few challenges  in balancing time and crossing campus
to the different sessions, but the session surveys show that most of the  

participants were pleased with the  

sessions. In the future, we're going to schedule two computer labs at the start.


I owe a massive mea culpa to those who

couldn't attend. Next year's conference will   

be scheduled in the first or second week of  

June. I recognize that Brookings is not the  

center of the universe, and just because  

finals are over, and grades are reported at  

state, I shouldn't assume all schools have  

let out for summer. I don't need to write it  

fifty times on the blackboard -  the  

message was repeated and clear.


We emphasized methods of accessing,  

downloading and manipulating data in the

conference, and will continue several of  

those sessions next year - but next  

year'sparticipants will be able to select  

their

sessions when they pre-register. If  


we're going to have two computer labs  

going, we might as well have choices.


The best-liked sessions were: Mastering

Factfinder, Shortcuts Through Missouri,  

and OnTheMap. All of the PowerPoint   

exercises  used in the conference will be

posted on the data center website - if you  

missed the conference, you'll at least be

able to attend virtually over your own  

computer.


Thanks to all who attended and helped  

make South Dakota's first Demography  

Conference a success.


Mike McCurry

Demography Conference:

Evaluating the Process  


How did attendees evaluate  

individual sessions?  

Click links below to find out!  


Session 1 Projecting SD Evals Review    


S2 Migration Review    


S3 Challenges in Data Review    


S4 Indian Country Review    


S5 What Can Data Center  

Provide Review    


S6 Data for Communities Review    


S7 Data in Indian Country Review    


S8 Data Center Findings    


S9 BIDC Lost Review    


Overall 2013 Conference Scores    


Conference Summary    


-Valeriah Vasek


* * * * * * * * * *  


  What We'll Change


What We Did at South Dakota's  

First Demography Conference...

As I look back on the Demography

Conference, after a few weeks to  

go through the evaluations, I'm  

convinced it was a success . . . and  

I'm equally convinced that there are  

things we could have done better.   

I'm more comfortable with self-

criticism, so let me start with the  

spots where we will improve next  

year.


1) The date.

Next year's conference will be
after every school has finished
finals, and the date will be set far
enough ahead that folks can plan
for it.  In 2014, the South Dakota
Demography Conference will
occur on June 10, 11, and 12th.


2) Hands-on Practical Applications.

We underestimated the folks who
were interested in demography.

Our largest computer lab had 32
stations, and we had 44 people
attending, which meant we had to
split the audience between two
labs, and put on each presentation
twice. It worked, but it was
unwieldy.Next year's conference
will have Practical Applications
sessions scheduled in two labs,
plus a simultaneous breakout
session, and folks will be able to
pre-register for the specific
sessions they want.

3)  Registration. We weren't as
efficient in handling registrations
as we will be next year.


4) University Credit.Six participants took advantage of the opportunity
to get 1 university credit for $40
more than the registration.We will
attempt to maintain this opportunity.    


5)  Underestimating the appeal.   

We began with a plan that could  

handle a maximum of 32 people.  

Next year, our planning target will  

be 100.


Mike McCurry, Ph.D.

Planning for the next
Demography Conference 


As I write this, we're a week after the  

first state demography conference - and  

we're upbeat. When we passed 32 pre-

registrations, we had to grab a second  

computer lab to be able to include all 44  

participants. That created a few challenges in balancing time and crossing campus

to the different sessions, but the session  

surveys show that most of the participants were pleased with the sessions.


The synopsis is that we're going to keep  

doing the annual demography conference

- and we're going to schedule two  

computer labs at the start. In this  

newsletter, we're including a survey link  

for your input in planning the next  

conference.


I owe a massive mea culpa to those who

couldn't attend. Next year's conference will  be scheduled in the first or second week of June. I recognize that Brookings is not the center of the universe, and just because finals are over, and grades are reported at state, I shouldn't assume all schools have let out for summer. I don't need to write it fifty times on the blackboard - the message was repeated and clear.


We emphasized methods of accessing,  

downloading and manipulating data in the  

conference, and will continue several of  

those sessions next year - but next year's

participants will be able to select their  

sessions when they pre-register. If we're  

going to have two computer labs going, we might as well have choices.


The best-liked sessions were: Mastering  

Factfinder, Shortcuts Through Missouri,  

and OnTheMap. All of the PowerPoint   

exercises  used in the conference will be  

posted on the data center website - if you missed the conference, you'll at least be  

able to attend virtually over your own  

computer.


Thanks to all who attended and helped  

make South Dakota's first Demography  

Conference a success.

Mike McCurry


Demography Conference:

Evaluating the Process 


How did attendees evaluate  

individual sessions?  

Click links below to find out!  


Session 1 Projecting SD Evals Review    


S2 Migration Review    


S3 Challenges in Data Review    


S4 Indian Country Review    


S5 What Can Data Center  

Provide Review    


S6 Data for Communities Review    


S7 Data in Indian Country Review    


S8 Data Center Findings    


S9 BIDC Lost Review    


Overall 2013 Conference Scores    


Conference Summary    

-Valeriah Vasek


What We'll Change


What We Did at South Dakota's  

First Demography Conference...

As I look back on the Demography

Conference, after a few weeks to  

go through the evaluations, I'm  

convinced it was a success . . . and I'm equally convinced that there are  

things we could have done better.   

I'm more comfortable with self-

criticism, so let me start with the  

spots where we will improve next  

year.


1) The date.
Next year's conference will be
after every school has finished
finals, and the date will be set far
enough ahead that folks can plan
for it.  In 2014, the South Dakota
Demography Conference will
occur on June 10, 11, and 12th.

2) Hands-on Practical Applications.
We underestimated the folks who
were interested in demography.
Our largest computer lab had 32
stations, and we had 44 people
attending, which meant we had to
split the audience between two
labs, and put on each presentation
twice. It worked, but it was
unwieldy.Next year's conference
will have Practical Applications
sessions scheduled in two labs,
plus a simultaneous breakout
session, and folks will be able to
pre-register for the specific
sessions they want.

3)  Registration. We weren't as
efficient in handling registrations
as we will be next year.

4) University Credit.Six participants took advantage of the opportunity
to get 1 university credit for $40
more than the registration.We will
attempt to maintain this opportunity.
    

5)  Underestimating the appeal.   

We began with a plan that could  

handle a maximum of 32 people.  

Next year, our planning target will  

be 100.


Mike McCurry, Ph.D.


Mike's Favorite Websites:


ACS Profiles (Missouri)

http://mcdc1.missouri.edu/acsprofiles/acsprofilemenu.html


Agriculture

http://www.agcensus.usda.gov/


American FactFinder

http://factfinder2.census.gov/


Bureau of Economic Analysis

http://www.bea.gov/regional/bearfacts/


Center for Disease Control

http://www.cdc.gov/


County Level Data

http://censtats.census.gov/usa/usa.shtml


County Business Patterns

http://www.census.gov/econ/cbp/index.html


Crime

http://www.fbi.gov/about-us/cjis/ucr/ucr


Health Stats

http://www.statehealthfacts.org/


Historical Census Browser

http://mapserver.lib.virginia.edu/


Life Expectancy

http://www.worldlifeexpectancy.com/


Migration

http://interactive.taxfoundation.org/migration/


Missouri State Data Center

http://mcdc.missouri.edu/


Mortality (CDC)

http://wonder.cdc.gov/cmf-icd10-archive2005.html


Onthemap

http://onthemap.ces.census.gov/


SD Labor

http://dlr.sd.gov/lmic/default.aspx


Statistical Abstracts

http://www.census.gov/compendia/statab/


  Mike's turtle friend  


South Dakota State Data Center Affiliates


Black Hills Council of Local Governments


Central South Dakota Enhancement District


First District Association of Local Governments


Governor's Office of Economic Development


Karl E Mundt Library


Labor Market Information Center


Northeast Council of Governments


Northern State University


Planning & Development District III


Rural Life Census Data Center


Sioux Falls Planning Department


South Dakota Department of Health


South Dakota Kids Count


South Dakota State Data Center


South Dakota State Library


Southeast Council of Governments

This newsletter is now going out to 1048 recipients!  
Join the fun! 
Join Our Mailing List!

~~~ 
We hope you enjoy this issue of the Rural Life Census Data Center newsletter. If you have any news tips or items that you would like to see included in a future newsletter, let us know at: 605-688-4899 or email: michael.mccurry@sdstate.edu  


Come see us on Facebook and let us know you were there!
https://www.facebook.com/pages/South-Dakota-Rural-Life-and-Census-Data-Center/548981831787534?ref=hl    
~~~