|
Special Update: The Labor Market in 4 Charts
|
Weekly Update - May 5, 2014
|
|
|
|
|
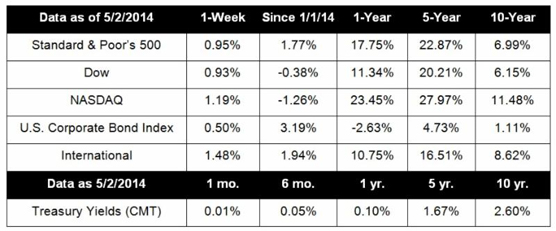
Markets ended another volatile week on an upbeat note after a wave of economic data showed that the economy is still on the right track. For the week, the S&P 500 gained 0.95%, the Dow grew 0.93%, and the Nasdaq gained 1.19%.[1]
|
|
|
One of the biggest headlines last week was the April jobs report, which showed that 288,000 new jobs were added in April, many more than economists had predicted. Even better, employment gains were widespread and represented growth in multiple sectors across the economy.[2]
The monthly jobs report garners a lot of attention. We wanted to use this week's update to dig deeper into some of the data behind employment reports to show you why jobs numbers are watched so closely.
Why do labor market reports matter?
Employment reports matter to the overall economic picture because jobs growth is an important stimulus for economic growth. Job growth is highly correlated with improvements in consumer confidence, which often presage increases in spending.[3] Since spending accounts for over two-thirds of economic activity, you can understand why analysts monitor the labor market closely.
Is the labor market actually improving?
If you've been keeping tabs on the many labor market-related headlines, you've probably heard pundits say that the labor market is showing signs of overall improvement. What does that mean, exactly?
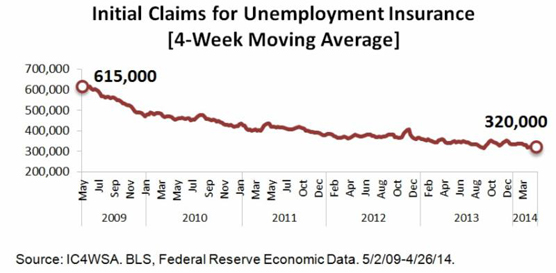
Let's look at some data. One of the most important short-term indicators of labor market health is the weekly initial claims for unemployment, which captures new applications for unemployment benefits. You can see in the chart below that the 4-week moving average of initial claims (a much less volatile measure than weekly claims) has been steadily declining since the recession peak in 2009. While the data is volatile and 'noisy,' the long-term trend shows significant improvement.

Another important indicator is the number of voluntary separations, which tracks workers' willingness and ability to leave their jobs. Generally, this happens when folks find a better job, so it's a good signal of improvements in the quality and quantity of jobs available. This chart shows that the number of monthly quits has been on a general upward trend since early 2009.
However, the picture isn't completely rosy. Much of the fall in the employment numbers released last week can be attributed to the more than 800,000 Americans who dropped out of the labor force in April.[4]
Realistically, declining labor force participation is probably going to stay with us as baby boomers continue to retire and young people wait longer to find employment. However, most of the recent decrease comes from discouraged workers who are dropping job searches out of frustration. This is troubling.
The Bureau of Labor Statistics (BLS) defines discouraged workers as those who want a job but are not currently looking because they don't believe jobs are available or that they qualify for current opportunities.[5] You can see that the measure of discouraged workers is extremely volatile, but the overall trend since 2011 is downward, which is where we want it to be.[6] However, we've still got a long way to go before workers and their skills will match available jobs.
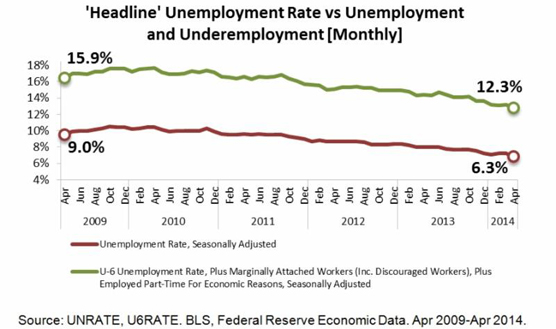
What Does the Unemployment Rate Actually Show? You've probably heard a lot about the unemployment rate. However, did you know that the government calculates six different measures of unemployment? The so-called headline rate is officially known as the U-3 measure and calculates total unemployed as a percent of the total civilian labor force. For a broader measure, we can look at the U-6 rate, which also captures under-employment. This calculation includes people who, while they don't meet BLS definitions of unemployed, still suffer the effects of a weak job market. 
The top line shows this broader measure of unemployment. Right now, while the headline unemployment rate is 6.3%, we can tack on another 6.0%-worth of discouraged, under-employed, and forced part-time workers. Digging a bit deeper, involuntary part-time work is the largest contributor to the difference between headline unemployment and the U-6 measure, indicating that, while many Americans have jobs, they aren't able to work as much as they might like.[7]
Bottom Line: The Labor Market Is Improving
Overall, medium- and long-term trends in employment data show that the labor market is largely getting better. However, in the short-term, seasonal effects, unique business events, and other factors can make the jobs picture much less clear.
This is why policy makers like the Federal Reserve look at a variety of indicators (including the data we've examined in this update) to develop a more nuanced view of what is happening in the economy. As financial representatives, it's our job to monitor many different indicators, including the data we've shared with you in this update, to understand the current economic picture and develop strategies for our clients.
I hope you've enjoyed our foray into some of the numbers behind the employment headlines. We enjoy providing educational and informative content, and we welcome any comments or questions you may have.
ECONOMIC CALENDAR:
Monday: ISM Non-Mfg. Index
Tuesday: International Trade
Wednesday: Productivity and Costs, Janet Yellen Speaks 10:00 AM ET, EIA Petroleum Status Report
Thursday: Jobless Claims, Janet Yellen Speaks 9:30 AM ET
|
|
|

Notes: All index returns exclude reinvested dividends, and the 5-year and 10-year returns are annualized. Sources: Yahoo! Finance and Treasury.gov. International performance is represented by the MSCI EAFE Index. Corporate bond performance is represented by the DJCBP. Past performance is no guarantee of future results. Indices are unmanaged and cannot be invested into directly.
HEADLINES:
First quarter GDP estimate shows weak performance. Investors got their first look at Q1 Gross Domestic Product (GDP) growth and the current estimate shows that the U.S. economy grew a sluggish 0.1%, mostly because of the lingering effects of winter.[8] Keep in mind that economic estimates change frequently, and revised data may show a more upbeat picture.
Federal Reserve continues taper. The Federal Open Market Committee (FOMC) met last week and voted to continue tapering, decreasing monthly bond purchases to $45 billion. The move wasn't a surprise to analysts, but it serves to underscore the Fed's faith in the economic recovery.[9]
Consumer spending soars in March. Warmer weather encouraged American shoppers to return to malls and car dealerships, boosting consumer spending by the highest amount in nearly five years.[10]
Ukrainian crisis turns violent. Ukrainian military forces engaged pro-Russian insurgents in eastern Ukraine, attempting to regain control over the economically important east. Russia continued to mass troops on the border and warns they will respond to attacks on Russian interests.[11]
|
|
"Definiteness of purpose is the starting point of all achievement."
- W. Clement Stone
|

These easy crepes make an elegant brunch for guests.
|
|
Ingredients:
Serves 6
1 1/2 cups whole milk
4 large eggs
1 cup all-purpose flour, sifted
3 tablespoons unsalted butter, melted, plus more for the skillet
1/4 teaspoon kosher salt
1/2 teaspoon finely grated lemon zest plus 2 teaspoons lemon juice, plus 1 thinly sliced lemon
1/2 cup plus 1 tablespoon sugar
1 cup ricotta (look for old-fashioned or whole-milk ricotta)
1 tablespoon honey, plus more for drizzling
Directions:
1. Whisk or blender milk, eggs, flour, butter, salt, lemon juice, and one TB sugar until foamy and thoroughly combined. Transfer the batter to the refrigerator and allow to rest for at least one hour or overnight. This will improve the crepe consistency.
2. Make syrup by boiling ½ cup of water with the remaining sugar in a saucepan over medium heat until the sugar dissolves. Add the thinly-sliced lemon and simmer 5-7 minutes until translucent.
3. After the batter has rested, wipe a nonstick skillet with a stick of butter and heat over medium. Add about ¼ cup of crepe batter and swirl so it coats the pan evenly. Cook 2-3 minutes until golden brown. Use a spatula to loosen the crepe and flip. Cook 1-2 minutes more.
4. Transfer crepes to a plate as they are ready, stacking one on top of the other.
5. Combine the ricotta, lemon zest, and honey. Spread about 1-2 TB of the mixture onto each crepe, rolling them up and plating when done.
6. Top each plate with lemon slices and drizzled with additional honey.
Recipe adapted from Charlyne Mattox | RealSimple.com
|
|
Free Tax Help for Military Families
|
The IRS provides free tax help to military members and families through the Volunteer Income Tax Assistance program. VITA offers free tax preparation and advice at sites on and off base. Volunteers receive training on military-specific tax issues like combat zone tax benefits, special filing extensions, and other special rules. For more information about filing taxes as a member of the armed forces, speak to a tax advisor or see IRS Publication 3, Armed Forces' Tax Guide. Tip courtesy of IRS.gov[12]
|
|
Many amateur golfers make the mistake of overusing their legs during a swing. While you want to use your legs for leverage and stability, wild gyrations will slow your clubhead and rob you of speed and power. If you're having trouble with your legs, ask an instructor to check for a lack of proper upper body movement.
Tip courtesy of Joe Thiel, PGA | Golf Tips Mag[13]
|
|
Protect Your Knees With Simple Exercises
|
|
As you get older, your knee goes through physical changes that make it more prone to injury and pain. Strengthening the muscles around the knee will help support and stabilize it, reducing the load the joint has to carry. Check with your physician to see if you're able to do any of these simple exercises:
Wall squat: With your back against a wall, lower yourself until your thighs are parallel to the floor, and hold for 10 seconds, then slowly straighten.
Side shuffle: Just like in gym class, shuffling your feet from side to side will help warm up and strengthen the muscles on the side of your knees.
Straight leg lift. Sit on the floor with one leg bent and the other straight in front. Raise the straight leg just a few inches and hold for 5 seconds. Switch to the other leg.
Tip courtesy of AARP[14]
|
|
Take a Conservation Vacation
|
|
Looking for travel ideas? Consider combining your vacation with important outdoor work. Many different organizers, including the Sierra Club and the Earthwatch Institute, offer trips with activities ranging from trail maintenance in national parks to tagging endangered animals. Costs can vary tremendously, so check with organizers to find a trip that suits your budget and desired activity level.
Tip courtesy of AARP[15]
|
|
Share the Wealth of Knowledge!
Please share this market update with family, friends, or colleagues. If you would like us to add them to our list, simply click on the "Forward email" link below. We love being introduced!
|
|
|
Investing involves risk including the potential loss of principal. No investment strategy can guarantee a profit or protect against loss in periods of declining values.
Diversification does not guarantee profit nor is it guaranteed to protect assets.
The Standard & Poor's 500 (S&P 500) is an unmanaged group of securities considered to be representative of the stock market in general.
The Dow Jones Industrial Average is a price-weighted average of 30 significant stocks traded on the New York Stock Exchange and the NASDAQ. The DJIA was invented by Charles Dow back in 1896.
The Nasdaq Composite is an index of the common stocks and similar securities listed on the NASDAQ stock market and is considered a broad indicator of the performance of stocks of technology companies and growth companies.
The MSCI EAFE Index was created by Morgan Stanley Capital International (MSCI) that serves as a benchmark of the performance in major international equity markets as represented by 21 major MSCI indexes from Europe, Australia and Southeast Asia.
The Dow Jones Corporate Bond Index is a 96-bond index designed to represent the market performance, on a total-return basis, of investment-grade bonds issued by leading U.S. companies. Bonds are equally weighted by maturity cell, industry sector, and the overall index.
The S&P/Case-Shiller Home Price Indices are the leading measures of U.S. residential real estate prices, tracking changes in the value of residential real estate. The index is made up of measures of real estate prices in 20 cities and weighted to produce the index.
The 10-year Treasury Note represents debt owed by the United States Treasury to the public. Since the U.S. Government is seen as a risk-free borrower, investors use the 10-year Treasury Note as a benchmark for the long-term bond market.
Google Finance is the source for any reference to the performance of an index between two specific periods.
Opinions expressed are subject to change without notice and are not intended as investment advice or to predict future performance.
Past performance does not guarantee future results.
You cannot invest directly in an index.
Consult your financial professional before making any investment decision.
Fixed income investments are subject to various risks including changes in interest rates, credit quality, inflation risk, market valuations, prepayments, corporate events, tax ramifications and other factors.
These are the views of Platinum Advisor Marketing Strategies, LLC, and not necessarily those of the named representative, Broker dealer or Investment Advisor, and should not be construed as investment advice. Neither the named representative nor the named Broker dealer or Investment Advisor gives tax or legal advice. All information is believed to be from reliable sources; however, we make no representation as to its completeness or accuracy. Please consult your financial advisor for further information.
By clicking on these links, you will leave our server, as they are located on another server. We have not independently verified the information available through this link. The link is provided to you as a matter of interest. Please click on the links below to leave and proceed to the selected site.
[6] N.B. The time period in this chart is different because the BLS changed its calculation method for discouraged workers in January 2011, rendering comparisons before and after the change problematic.
|
 |
|
|
|
|
Copyright © 2014. All Rights Reserved.
|
|
|