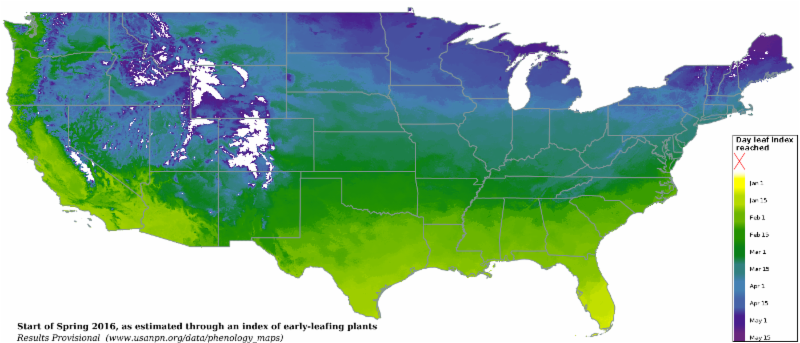
By now I hope you've had a chance to explore our our new gridded phenology maps based on Accumulated Growing Degree Days (AGDD) and the Extended Spring Indices (SI-x). These maps can be accessed on the USA-NPN visualization tool as well as via the USA-NPN Geoserver. We'd love to hear from you if you are using or thinking about using these products in your research, outreach and natural resource management activities.
In the coming month we'll be releasing a new user-friendly Phenology Observation Portal for you to download Status and Intensity data, Individual Phenometric data, and Site Phenometric data. With over 8 million phenology status records now available in the National Phenology Database, we hope you will dig in and check out what is available for your region and species of interest.
Read more below about a recent paper that used NPN data to study invasive grass phenology in Arizona, and a report on the Phenology Model workshop held in Tucson last Spring. Thank you for being part of this vibrant phenology research community!
|
|
What's new at the USA National Phenology Network
|
|

Phenology model workshop report
The National Coordinating Office has released a report from the Phenology Model Workshop held in March 2016 in Tucson, Arizona. Here we describe some challenges and next steps for generating the next generation of predictive phenological models. Stay tuned for more publications and results from this effort, and for future opportunities to get involved with NPN working groups!
|

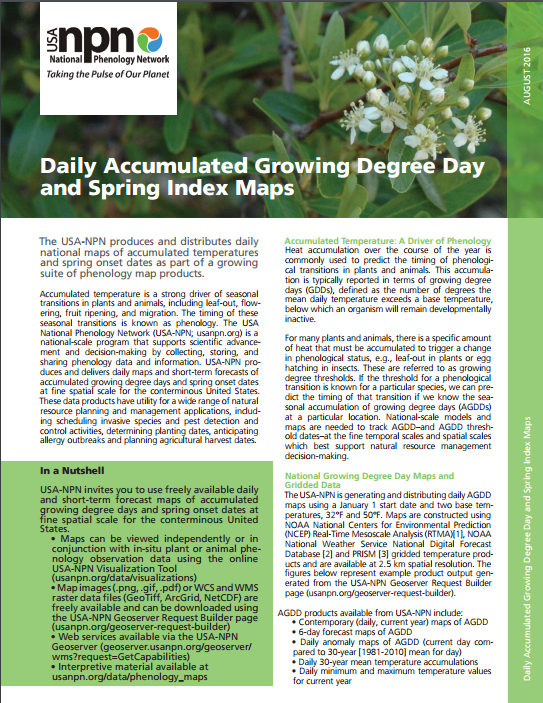
Phenology maps info sheet
|
|

-
American Geophysical Union. San Francisco, CA. December 12-16, 2016. We anticipate that there will be multiple sessions and presentations related to phenology, stay tuned!
|

Predicting the spread of a invasive grass using citizen science data and MODIS data
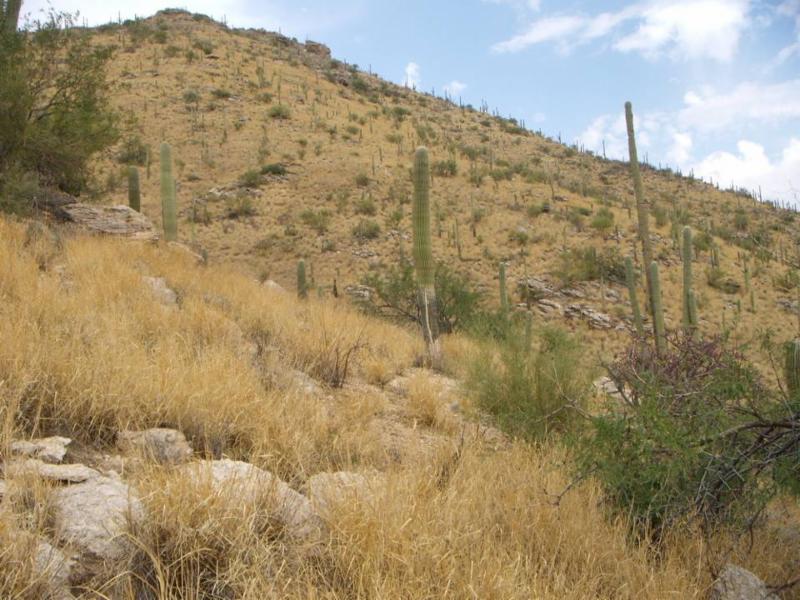
In a recent paper in the journal Remote Sensing, Wallace and colleagues used USA-NPN observation data combined with PRISM climate data and MODIS-derived land surface phenology data to optimize management of buffelgrass, an invasive grass. Their goal was to detect where the invasive plants are located in Saguaro National Park and when they are photosynthetically active. They found that prior rainfall was a strong predictor of the timing of greenness.
|

Understanding forest tree phenology using satellite and citizen science data
Using data submitted to Nature's Notebook via the Popclock project, Elmore and colleagues investigated the correlation between land surface phenology derived from MODIS data and citizen scientists' phenology observations on 25 plant species. In the article, published in Remote Sensing, the researchers found that quality control processing of the observation data coupled with restricting the MODIS data to forested pixels resulted in a high degree of correlation between the citizen science observation data and land surface phenology.
|

Identifying historical and future early spring onsets
Using the new Community Earth System Model Large Ensemble project, Labe and colleagues applied the gridded Spring Indices to simulate historical and future spring onsets with a focus on the Great Lakes region in a recent article published in the journal Climate Dynamics. They predicted an overall trend in spring onset dates into the future, with an expected increase in extremely early springs comparable to 2012, the earliest spring on record.
|
|
|
|