The "dog days" of summer...I hope you're enjoying fireworks, cookouts, and swimming, as well as full leaf canopies, full bloom, and lots of animal sightings! We've been dodging the heat here in Tucson as best as we can, and cooking up a few fun things for you...

Thank you again for the data you submit to 
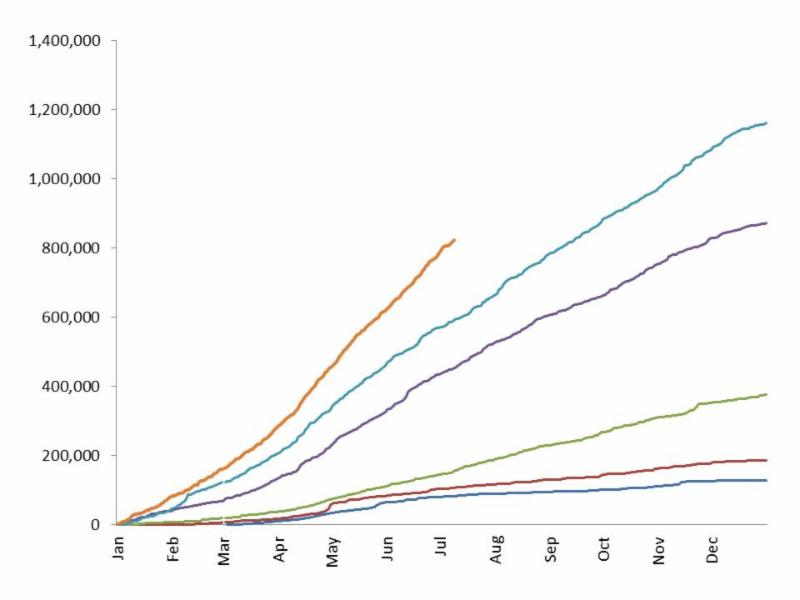
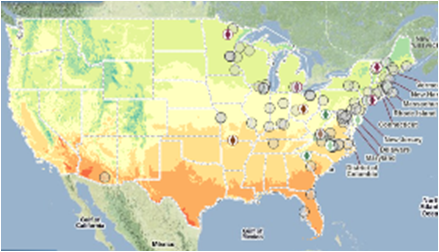
Nature's Notebook...did you know that you can get your data back out, and view your observations in map and graph form using the Data Visualization Tool? We're hoping to improve this tool in coming months, and we'd love to hear your thoughts on what would make it easier to use via this Survey.

You've probably noticed a new name in your email inbox, if you're signed up to receive one of our campaign messages. Erin Posthumus, our Outreach Associate, has taken ownership of this communication. She's doing a wonderful job, in my opinion. If you're not receiving her messages, you can sign up for them in the right side-bar of the campaigns pages.

Have a great summer! 

 
What your data are telling us
Your observations predict spread of ragweed 

Researchers in Europe used observations of ragweed phenology collected via Nature's Notebook to show that as the climate warms, ragweed will expand its distribution to the north...bad news for folks that suffer from this highly allergenic plant.
Data submission is greater in 2014 than all previous years 

Participants are submitting more phenology observations per day this year than in any previous year! The graph at right shows the cumulative growth in observations submitted for each year, 2009-2014. The top orange line is 2014 - you've already submitted nearly three-quarters of a million records so far this year! Thanks for contributing to this valuable data resource!
What's new at Nature's Notebook and USA-NPN
iPhone app works offline, stores data locally 

If you've hesitated to collect your observations using your smartphone or tablet because you were out of wifi or cell range, worry no more. Both iPhone and Android versions of the apps now store data locally when you are out of range, and will automatically upload the data once your connection is restored.

Download iPhone or Android apps
Nature's Notebook webinars

Don't miss out! The next webinars on the agenda include:
  • September 2nd, 2014: Partner showcase: Learn how other groups are using Nature's Notebook (this webinar is specifically for Local Phenology Leaders) Register for webinar 
  • September 23, 2014: Gaining 100% confidence in intensity estimates Register for webinar 
Webinars take place at 11am Pacific (and AZ), 12pm Mountain, 1pm Central, 2pm Eastern.

Recordings of webinars hosted earlier this year are available for viewing on the USA-NPN YouTube page.

Recent happenings in the field of phenology
Short video answers, "Why track phenology?"  
Can a status update from a flower tell us something about climate change? Researchers at UC Santa Barbara explain how studying the life-cycle of plants can give us a wealth of information about climate.
Phenology researchers report findings 

Is spring coming earlier than it used to? If it is, so what? Several prominent phenology researchers share their findings and the implications for these changes in a recent article in the New York Times.  
More ways to get involved
What are your thoughts on the Data Visualization Tool?

Please share your thoughts with us on our data visualization tool! Were you aware there is such a tool? Do you use it? Help us improve this tool as we consider updates!

Contact

 
Theresa Crimmins
Partnerships & Outreach Coordinator
520-622-0363
 

STAY CONNECTED

Like us on Facebook   Follow us on Twitter   View our videos on YouTube