|
Together.
Shaping the future of roadway safety.
|
|
February, 2016
- In this edition we improved the Data Session selection tool and made it faster; added additional filtering features to Data Sessions, Curves and Bulk Data Export; and added vertical data collection and reporting as an option.
|
New Data Session Selection Tool -
As we introduced last year, you can find and select all your data sessions right from the Google Map area. But now it will work even faster and work over a size area - even the whole State. From the Data Sessions tab, you click on the map area to cast a 'Net'. One click for each of the two corners of a net will display a square on the map. This action will automatically select all your data sessions that have a data point within the boundaries of that net. The selection can be viewed and filtered in the header list of data sessions. You'll notice a few changes:
- All Data Sessions data poi
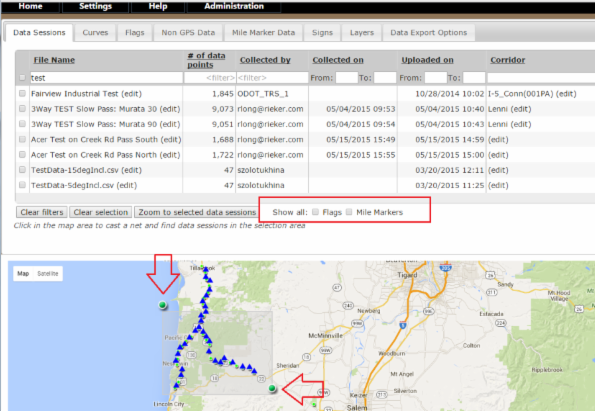 nts will be rendered as green dots. You will no longer have to choose the toggle to turn on induvial data points. You will see for larger areas, the green dots will be consolidated as fewer dots. However, at tighter zoom levels all the actual data points will be rendered. nts will be rendered as green dots. You will no longer have to choose the toggle to turn on induvial data points. You will see for larger areas, the green dots will be consolidated as fewer dots. However, at tighter zoom levels all the actual data points will be rendered. - You can see all the curves, rendered as blue triangles on the Data Sessions page. Again, large areas of many curves will be consolidated into fewer triangles, but at lower zoom levels all the curves will be shown in the historic blue line.
- You can add Mile Markers and/or Flags to be displayed on the Data Sessions page. And again, will consolidate as needed depending on zoom level. Mile Markers will be displayed as a red dot and Flags will be displayed as a blue flag
Learn More
|
New Filters on the Data Session and Curves Tab - There are a few changes to the filtering options on both Data Sessions and Curves tab. Specifically, you can now specify date ranges. And, the Corridor filter is replaced with a drop down selection of all available Corridors. 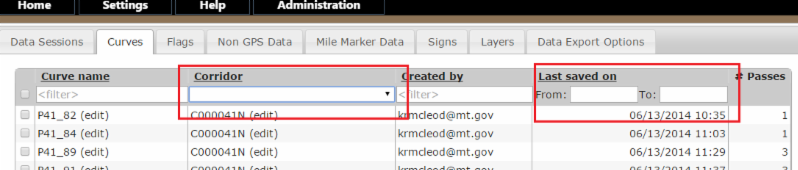 Learn More Learn More
|
Vertical GPS Data - With the latest update to the tablet, the Data Sessions will now automatically collect altitude data from the GPS. The addition and inclusion of this data has no impact on the advisory speed calculations, 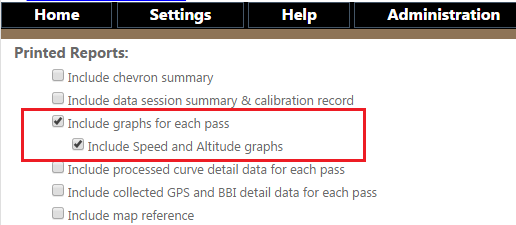 which continue to come from the prescribed FWHA method. The vertical data can be displayed graphically. To see the data, select "Include Speed and Altitude" graphs, which can be found under "Include graphs for each pass" on the Setting Page. Learn More which continue to come from the prescribed FWHA method. The vertical data can be displayed graphically. To see the data, select "Include Speed and Altitude" graphs, which can be found under "Include graphs for each pass" on the Setting Page. Learn More
|
Bulk Data Export Filtering - We have added additional filters to the Bulk Export Options tab. You can now filter your bulk data export by Date range and or Corridor. This will be very useful for producing a "Corridor Report". As before, you can choose between data as a .csv or a printed PDF. In the case of a printed PDF, the printed report will use the options chosen in Settings. As before, the export may take a long time. You can close the browser and come back at a later time and any exports created in the past week will be listed on the page for download. Learn More 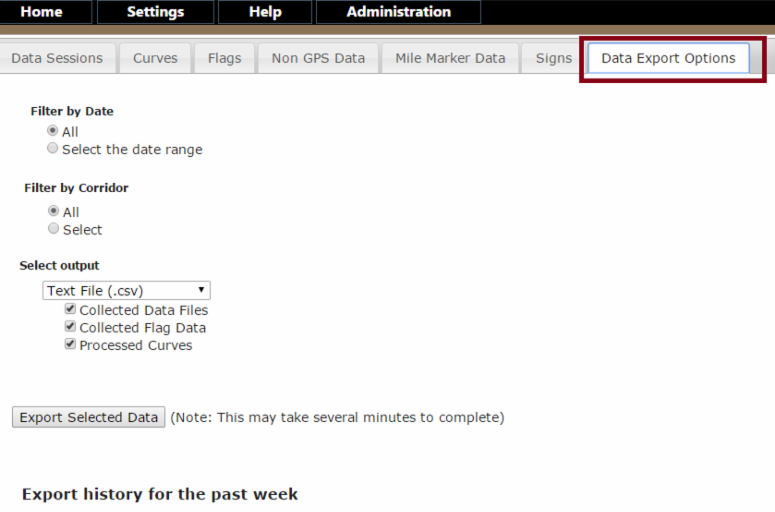
|
Forgot Password & Login Reset - Reminder that you can reset your password if you forget it. You can do this by clicking "Forgot Password" on the login screen. You need you User Name and license key. The system will update your password and present it to you on the screen. Remember or write down this temporary password. The password reset is now emailed to the email we have on file for that account. You can change and reset your password under My Account. **Remember to update your tablet with the new password. Attempting to login from the tablet with the old saved password will result in your account being locked out again, and you will have to reset it. Learn More
|
Coming Soon...
Flags and Signs
With the Flag feature, you can enter an engineering note, or the description of a
sign and the location will automatically be stored, using the Lat/Long from the device's internal GPS.
Over the coming year, Rieker is planning to enhance the Flag feature to be more useful in:
* Field collection and storing sign information
* Automatically generating and locating new signs from the Advisory Speed report
* Locating and editing tools to move signs and generate sign location reports
* Import/Export tools to integrate with customer's existing sign asset management repository
|
Technical Support Service Center
If you require additional help with CARS, please Email your questions to support@riekerinc.com or call (610) 500-2000 to speak with an expert.
We provide email and phone support through the CTSC Monday - Friday from 8:00am to 5:00pm Eastern Standard Time. We answer voicemail messages within a 24-hour time period with the exception of messages left in the system on Fridays-we'll answer those voice mails the next business day.
|
|
|
|