 Find Us at AMCHP's Annual Conference Find Us at AMCHP's Annual Conference

The Data Resource Center for Child & Adolescent Health is committed to advancing the vision of maternal and child health programs. Join us at the Association of Maternal & Child Health Programs Annual Conference in Washington, DC from February 9 to 12, 2013.
(click these)
|
|
Children with Special Health Care Needs in California:
A Profile of Key Issues

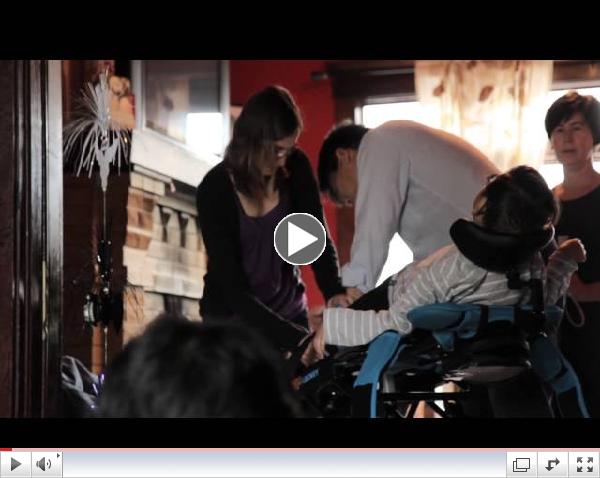
T he CAHMI worked with the Lucile Packard Foundation for Children's Health (LPFCH) to create this comprehensive report on the health and well-being of California's children with special health care needs (CSHCN) population. The report features data from the 2009/10 NS-CSHCN and provides a profile of demographic characteristics, physical, mental, and social functioning, and health and community service needs of CSHCN in California.
The Lucile Packard Foundation for Children's Health is working closely with a broad coalition of stakeholders within California to improve the systems of care for children with special health care needs. With less than 1 in 5 children with special health care needs meeting system of care criteria nationwide, California's efforts provide critical leadership to improve health across the life course for the growing population of children with chronic conditions in the US. | |
California Children with Special Health Care Needs
|
|
 A Leader in Title V Needs Assessment A Leader in Title V Needs Assessment |
|
The Data Resource Center partners with Title V leadership to develop data strategies to inform local system improvement efforts!
|
|
Measurement & Improvement
The CAHMI and DRC provide a broad range of valid, reliable child health and quality of care measures that can be used to assess system performance and opportunities for improvement. The parent-reported data from these measures may be further used to motivate your partners and drive a meaningful quality improvement strategy to positively impact child health.
Using Data Effectively: The DRC Can Help
Get up-to-speed on how the child health and quality of care data available through the DRC may be used for Public Health Accreditation along with how these data may be used to generate synthetic estimates for local, county and city health departments by reading this new DRC Data Brief. |
|
Bringing a Life Course Perspective to MCH |
|
Prevention and wellness across the life course is a national priority for the Maternal and Child Health Bureau. This includes a focus on environmental factors, systems of care, critical time-periods for development, and health equity. The DRC Web site contains point and click data from the National Survey of Children's Health and the National Survey of Children with Special Health Care Needs that map to key concepts embedded in the life course perspective, which promote a whole child approach to health over the life span. Here is an example of what you can find on the DRC website:
Neighborhood and School
Nationally, 51% of children met a neighborhood and school summary measure. These children live in safe and supportive neighborhoods and attend safe schools. 58.3% of children that received care within a medical home met the neighborhood and school summary index compared to 42.2% of children without a medical home. |