|
Below is the discussion topic of the week along with an overview of the economy and stock market as I see it. I hope you find this information useful and interesting.
I have added a new Executive Summary section to the newsletter in order to give a brief overview of the topic for those without the time (or interest) in the details. For those that enjoy the details, don't worry they aren't going away.
|
|
The Details
If you are waiting to hear from the Federal Reserve Bank (Fed) to answer that question, the answer is always "No". The Fed has never proactively forecasted a recession. You will get a similar response from the "consensus" of media economists. Although most people seem to utilize the rule of thumb of two consecutive quarters of negative GDP growth as their recession indicator, the official arbiter responsible for dating recessions is the National Bureau of Economic Research (NBER).
As a general rule, the NBER can take up to a year after the recession has begun to officially declare the recession start date. The reason for the delay is the economic data underlying their decision is often revised numerous times subsequent to its first release. Typically, as the economy is weakening, the more optimistic initial reports are revised lower as more information becomes available. With first quarter 2016 GDP growth coming in at a mere 0.8%, it would not take much revision to turn this number negative.
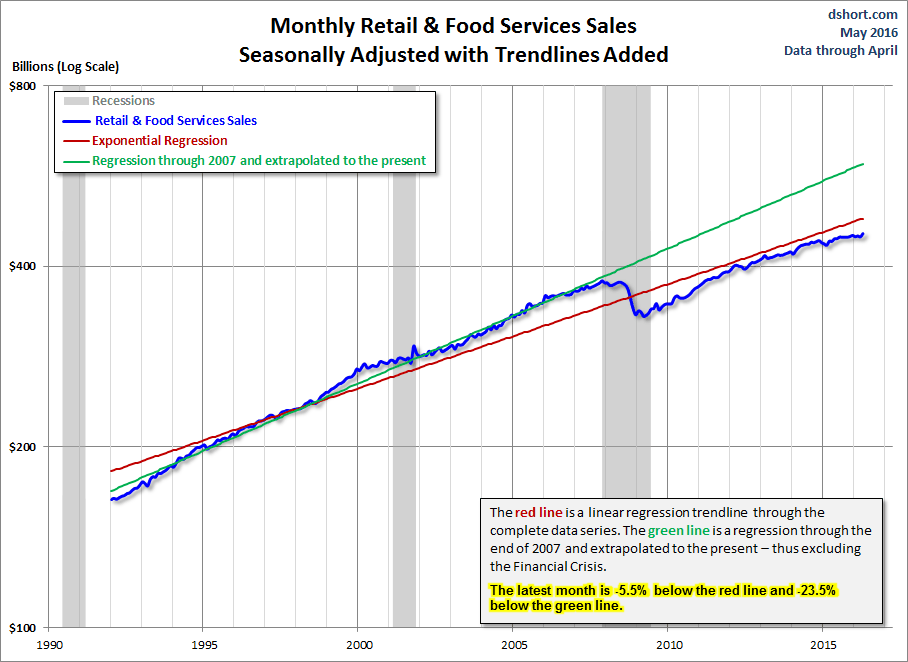
Close to 70% of GDP growth is attributable to consumption. The chart below prepared by Doug Short of Advisor Perspectives, displays the long term change in monthly retail and food services sales. A red trend line (linear regression) has been added illustrating the trend of actual sales. The latest monthly results fell 5.5% below the trend. The green trend line shows what the sales trend was for data through the end of 2007, the start of the previous recession. You can clearly see that since the recession, retail sales have not rebounded to the prior (green) trend line.

The weakness in retail sales is confirmed by the number of retail stores closing or filing bankruptcy. For instance, Sports Authority and Sports Chalet are closing all of their stores, and Aeropostale is on the brink. Ralph Lauren is closing over 50 stores and is eliminating 8% of its workforce. Macy's is closing 40 stores and cutting 4,500 jobs. Sears is in the process of closing 68 Kmart stores and 10 Sears locations. Wal-Mart is shuttering all of its 102 Wal-Mart Express stores and 52 of its full-size stores. The list goes on, but this provides an overview of the retail carnage.
"...economic deterioration typically follows a well-defined sequence, with weakness in what I call the "order surplus" (new orders + backlogs - inventories) followed by deterioration in industrial production (which retreated again last month) and by real retail sales (which have declined for two consecutive months), then real personal income (which is the next measure to watch here), and typically followed only then by weakness in employment indicators.
From the standpoint of that sequence, deterioration in the order surplus has been evident for several quarters now, and in January, our views shifted from concern to expectation of an imminent likelihood of recession. From that standpoint, the 'surprising' weakness in May payroll employment was actually a fairly standard reflection of lags in the employment data. Still, it's fair to say that economic data in recent months have been weak enough overall to maintain our recession concerns, but sufficiently mixed to temper a confident expectation. Our expectations of recession would become substantially more pointed in the event we observe more deterioration in real retail sales, real personal income, new claims for unemployment, and the equity market."
A chart of U.S. Economic Activity prepared by Hussman follows:
Hussman continued, "From an employment standpoint, we're also seeing notable weakness in payroll tax receipts, which has also accompanied prior recessions. Mike Shedlock and Liz Ann Sonders shared versions of the following chart last week. Withholding tax income growth has slowed to nearly zero, suggesting that employment measures are beginning to mirror the sequence of deterioration we've observed in more leading measures of economic activity in recent quarters."
Economist and financial advisor Lance Roberts in his weekly Real Investment Report quoted Michael Lebowitz of 720 Global Research as follows:
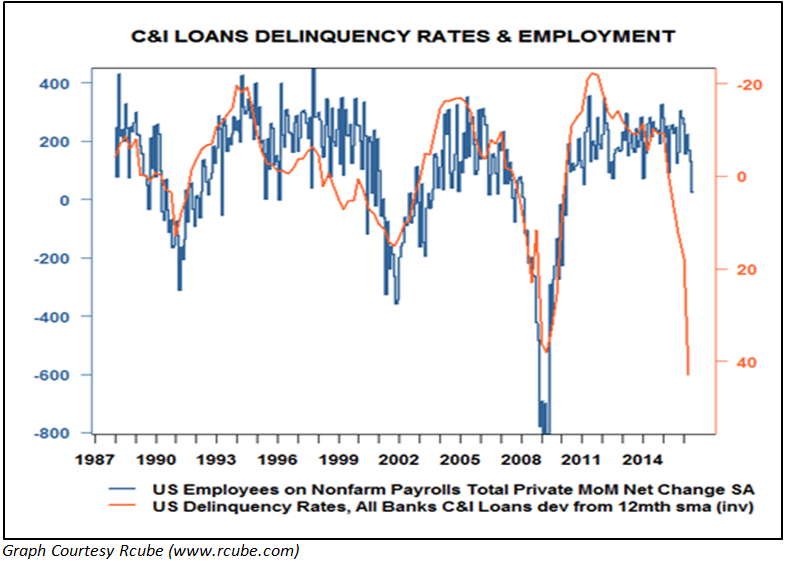
"Commercial and Industrial (C&I) loan delinquency rates, have a strong historical correlation with employment. C&I delinquency rates have risen over the last year and a half, in-line with the decline in corporate profits, to levels last seen four years ago. While the overall delinquency rate is still relatively benign, it is increasing sharply. Another important observation about the delinquency growth rate is that delinquencies tend to trend in one direction for long periods. Note: C&I loans are loans to corporations and businesses and not individuals. Data on these loans are reported on by the Federal Reserve.
The graph below, courtesy of Cyril Castelli of R-Cube, highlights the relationship between the rate of change in C&I delinquencies and employment. The delinquency rates are inverted to better highlight the correlation."

Below are graphs from Doug Short of the Philly Fed's Aruoba-Diebold-Scotti Business Conditions Index (ADS), the Chicago Fed's National Activity Index (CFNAI), and U.S. GDP.
The ADS was named for the three economists who devised it, the index, as described on its home page, "is designed to track real business conditions at high frequency."The index is based on six underlying data series:
- Weekly initial jobless claims
- Monthly payroll employment
- Industrial production
- Personal income less transfer payments
- Manufacturing and trade sales
- Quarterly real GDP
The CFNAI (here) is based on 85 economic indicators from four categories: - Production and income
- Employment, unemployment and hours worked
- Personal consumption and housing
- Sales, orders and inventories
Without delving into all of the indices details, a quick glance of current levels and long-term trends (red) speaks volumes regarding current economic activity.
I could go on with many more specific economic indicators, but the point here is the economic data is weakening. This is confirmed by falling retail sales, as well as plummeting corporate profits. Are we in a recession now? Maybe, maybe not. We won't know officially until declared by the NBER. By the time the NBER dates the start of the next recession, we will be well into it.
It is always interesting to go back and review the comments from the Fed and media economists made during the year when the U.S. was officially in a recession, but not yet declared. The deniers will continue to espouse their eternal optimism all the way up until it is official, then they will act like they saw it coming all along. Debt, demographics, and technology are factors preventing a trend reversal. It is time to stop kicking the can down the road.
The S&P 500 Index closed at 2,096, net flat for second week in a row. The yield on the 10 year Treasury note fell to 1.64%. Oil prices remained at $49 per barrel, and the national average price of gasoline according to AAA increased to $2.38 per gallon.
At Cremerius Wealth Management, portfolios are developed to take into account the state of the economy, market cycle and valuation, and relative strength. Our goal is long-term growth with limited downside potential. If you need assistance with your portfolio, please give me a call. I would be happy to review your situation and explain how we can help you work towards achieving your goals.
|
|
Best Regards,
Bob Cremerius, CPA/PFS |
|
© 2016. This material was prepared by Bob Cremerius, CPA/PFS, of Cremerius Wealth Management, and does not necessarily represent the views of other presenting parties, nor their affiliates. This information should not be construed as investment, tax or legal advice. Past performance is not indicative of future performance. An index is unmanaged and one cannot invest directly in an index. Actual results, performance or achievements may differ materially from those expressed or implied. All information is believed to be from reliable sources; however we make no representation as to its completeness or accuracy.
|
|
|
5100 Poplar Ave.
Suite 2220
Memphis, TN 38137
(901) 820-4406 |
|
Quick Fact
In 2011, the IRS collected over $2.4 trillion from around 234 million tax returns (which included corporate, individual, and employment tax returns). The IRS also provided approximately $416 billion in refunds.
Source
La Bella, Laura. 2011. How Taxation Works. New York, NY: The Rosen Publishing Group, Inc.
|
|