Are We Still in a Secular Bear Market?
Stock markets are measured in long-term and shorter-term time frames. We call these time frames "cycles". Long-term cycles are referred to as "secular" from the Latin saecul(um) for long-term. Secular cycles tend to last from one to two decades. Shorter-term cycles are called "cyclical" and often last anywhere from two to eight years. We typically call a rising market a "bull" market and a falling market a "bear" market.
The focus of this Weekly Market Update will be on secular market cycles. We will address cyclical cycles in future Updates. Secular bull markets begin when markets bottom at extremely undervalued levels, and end when markets peak at extremely overvalued levels. The purpose of secular bear markets is to burn off the excesses accumulated during the bull market and return markets to extreme undervaluation, positioned for the next secular bull.
The measurement typically used to determine the valuation of the market during these secular cycles is the Shiller Price/Earnings (P/E) ratio also known as the CAPE (Cyclically Adjusted P/E ratio). This ratio is calculated by dividing the current market price of the S&P 500 by 10-year average inflation-adjusted earnings. The long-term average Shiller P/E ratio is approximately 16.5.
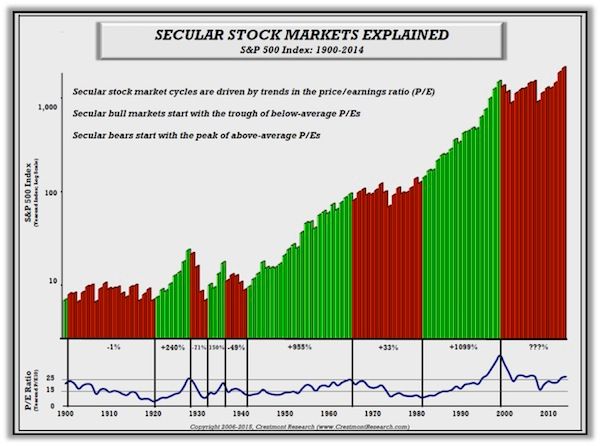
The last secular bull market began in the early 1980's and peaked with a Shiller P/E of about 44 in 2000. We are now 15 years into the current secular bear market. The benchmark for marking the end of a secular bear market is when the Shiller P/E ratio bottoms out in single digits. This indicates the excesses have burned off, and the economy and markets are positioned for the next long-term bull market. See graph of secular cycles below prepared by Crestmont Research (
www.crestmontresearch.com):
Note in the chart that secular bull markets are defined by a rather consistent escalation in the stock market. Secular bear markets, on the other hand, are denoted by point-to-point (beginning to end) flat or a slightly downward movement in the market. However, within these points, the market normally experiences one or more violent market crashes (cyclical bear markets) and recoveries (cyclical bull markets).
On a side note, it is visually apparent that "buy and hold" investing usually works well during secular bull markets, but can lead to lost decades and devastation in secular bear markets.
There are some who claim today that the secular bear ended in 2009 and we have since been in a secular bull market. I disagree with that assessment. First, neither the cyclical bear market subsequent to the technology bubble (2000-2002), nor the cyclical bear following the financial crisis (2008-2009) fell far enough to drop the Shiller P/E ratio to single digits. At the end of the technology instigated bear market, the Shiller P/E ratio did not bottom out until February 2003 and only hit 21.2, still far above the long-term average. After the financial crisis, the Shiller P/E fell to 13.3 in May 2009. While this was greater than the previous drop, it never reached single digits and shot up immediately reaching 20 by the end of 2009.
It has been my contention (along with others) that the sudden market burst back to bubble territory was attributable to the magnitude of stimulus actions instigated by the Federal Government combined with extreme monetary policy enacted by the Federal Reserve Bank (Fed). These measures were implemented as the Federal Government reached panic mode as large financial institutions were imploding. Instead of allowing our bankruptcy system to work as designed, it was determined that adding trillions in debt to bail-out private companies, and subsequently printing nearly $4 trillion to "boost" the economy were the proper solutions, but that is a topic for another day.
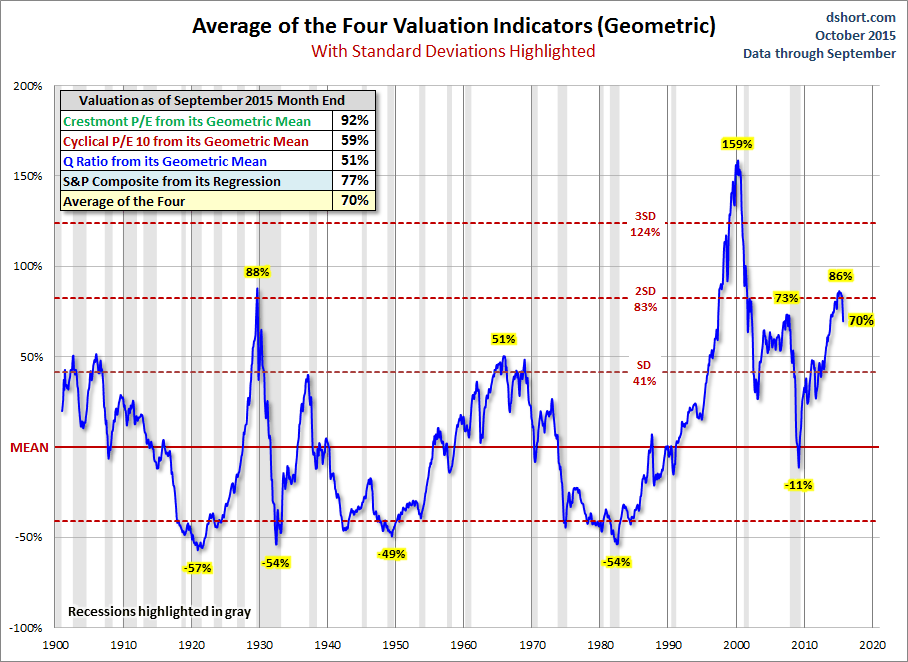
The lack of economic growth since the Great Recession and the current dismal global economic outlook do not substantiate the extreme overvaluation levels in the stock market. The Shiller P/E peaked this year around 27, and remains at the lofty level of 25.6. The jump in markets since 2009 is almost exclusively due to the trillions of dollars created from thin air along with excessively low, near zero percent, short-term interest rates. If after bottoming in 2009, market valuation had dropped to single digit P/E's, and the economy had dealt with the massive over-indebtedness, the economy could have been positioned for the next 15-20 year secular growth cycle. (See the graph below averaging four valuation methodologies, including the Shiller P/E prepared by Doug Short of Advisor Perspectives.)
Unfortunately, that did not happen. Before P/E's could truly bottom-out and debts could be dealt with through our bankruptcy process, the Fed and Federal Government were actively "saving" the economy by encouraging one of the largest asset bubbles in the history of the stock market, all while the economy meandered. See the graph of GDP growth below also from Doug Short.
Notice in the graph above, the 10-year moving average of real GDP growth is a mere 1.46%. The downward trend of the 10-year average can be seen by the solid line in this chart. Also, examine closely the downtrend in the red dotted linear regression line. The "boost" from trillions of dollars in printed money never surfaced.
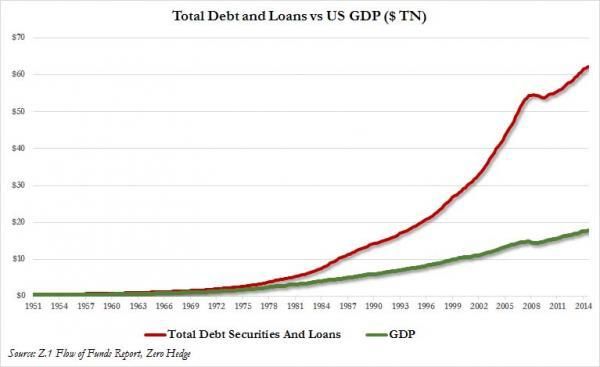
And regarding our debt levels, we have continuously attempted to solve our debt problems by borrowing more money. Total credit market instruments (or total debt) has now reached the unbelievable level of 350% of GDP. See the explosion of debt versus GDP in the chart below via Zero Hedge.
Therefore, it is my assertion that the economy has not been expanding as one would expect at the start of a new secular bull market. And, market action has been more attributable to Fed activities versus corporate revenue growth. A significant majority of the profit growth declared since the Great Recession has been attributable to the expansion of profit margins due to expense reductions (i.e. layoffs), and the illusion of earnings growth resulting from massive leveraged stock buybacks. Revenue growth has been negligible relative to multiple expansion.
I believe that it will take another cyclical bear market to burn-off the excesses needed to position the market for the next secular bull market. However, if the Fed and Federal Government intervene encouraging even more debt, instead of allowing a clearing of past excesses, the next secular bull will be delayed even further, as we remain trapped in an environment of serial cyclical cycles.
The S&P 500 Index closed at 1,951, up 3.3% for the week. The yield on the 10 year Treasury note increased to 2.10%. Oil prices rose to $47 per barrel and the national average price of gasoline according to AAA escalated to 2.32 per gallon.