| Quick Facts | |
1,296 Registered FL Observers
512 Active FL Observers
12,051 FL Reports Submitted during June
Greatest # of Daily Reports Submitted during June: 435 on 6/6/13
Most Rainfall Reported during June: 7.01" on 6/8/13 from Station FL-MD-33
|
|
|
|
A Note from Tennessee
|
I'd like to apologize to those observers who contacted me to let me know about the database hiccup the other day. I saw that the staff at CoCoRaHS HQ up in Fort Collins was able to handle the issue. I appreciate the dedication and diligence that you all have when it comes to making your report. I'm sorry I was unable to reply back to your emails, but I'm currently off enjoying a well-deserved vacation in Tennessee before I head off to the annual meeting of the American Association of State Climatologist in St. Louis, MO.
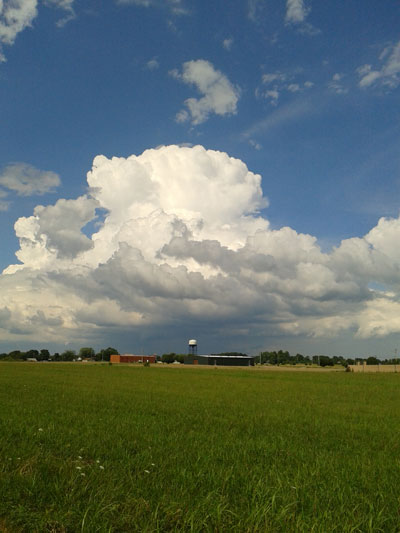 | | A Tennessee landscape. |
I hope that this newsletter finds you all in good health and spirits and that you have a wonderful 4th of July!
|
|
Rip Current and Lightning Safety
|
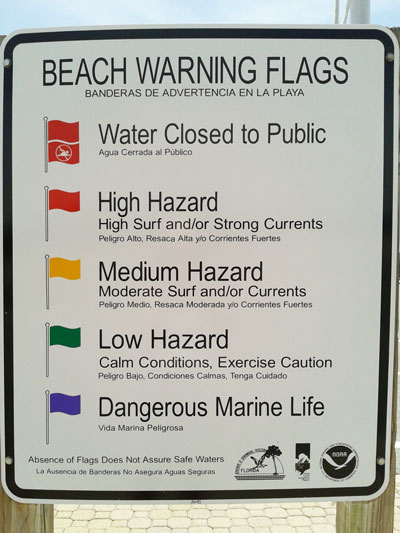
Since March, there have been a few dozen surf rescues and, unfortunately, about a dozen deaths along the Florida coast due to rip currents. Rip currents form when waves break near the shoreline, and some of the waves break stronger in some locations than others. This causes a circulation of fast-moving water that travels back offshore. There are signs posted at most beaches of a diagram of what a rip current looks like, and what to do if you're caught in one. In addition, the state of Florida has a beach flag system that can easily describe the surf condition based on a color scale.
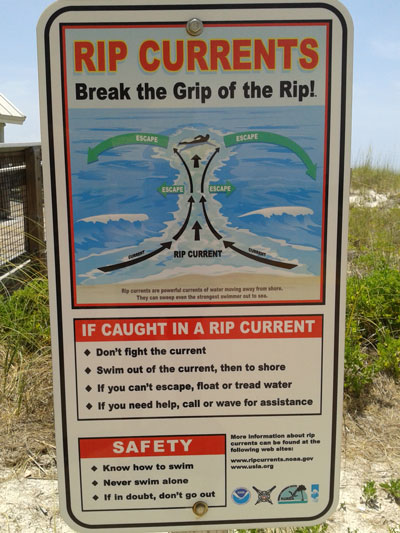 
Earlier in June, the National Weather Service dedicated a week to Rip Current Safety, which can be found at the following link: http://www.ripcurrents.noaa.gov/index.shtml
Lightning safety is also very important in a state that averages 25 strikes per square mile. This year alone, 2 people have died from being struck by lightning. June, July and August are the peak months for lightning activity across the United States and increased summer outdoor activities. The National Weather Service set aside the last week of June to promote and educate lightning safety across the U.S.: http://www.lightningsafety.noaa.gov/
|
|
Tropical Storm Andrea
|
Hurricane season got an early start this year with Tropical Storm Andrea forming in the Gulf of Mexico and quickly pushing through the state and up the East Coast. The rainfall totals, however, were not as high as we experienced during Tropical Storms Beryl and Debby last year. Rainfall totals from the 4th until the 10th did range from a Trace amount up to near 11 inches, across the state. The rainfall reports were helpful, but I wanted to highlight some of the observer comments that were included with the reports. These reports can be just as important and useful as the rainfall totals that we report every day.
From FL-HB-10, "Daybreak brought tropical storm conditions that included wind and rain throughout most of the day, and some tense moments around noontime when tornados were being tracked not far away here at my South Tampa location today. The good news, it appears the worst was over by 5PM and there wasn't any damage at my location."
FL-MR-12 reported that, "There was minor flooding in areas northwest of this station but not here."
And FL-PB-20 remarked, "Rough day, heavy rain w/wind gusts. Andrea packed a punch!"
|
|
June Rains
|
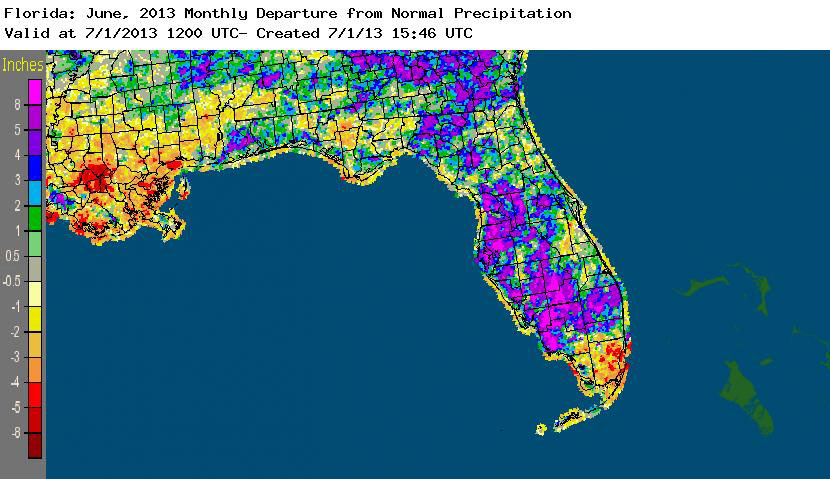
Rainfall totals across the state varied in June (Table 1). Portions of the Big Bend, northeast and south Florida recorded below normal rainfall (between 1 and 4 inches), while the western Panhandle and the western peninsula reported up to 8 inches above normal precipitation (Figure 1). Tropical Storm Andrea made landfall near Steinhatchee on June 6th and brought widespread heavy rain to portions of the Nature Coast. Due to the fast movement of the system, most of the area was spared from flooding, though minor flooding was reported along Tampa's Bayshore Boulevard. The rest of the precipitation during the month was characterized by typical summertime rainfall, with some of the stronger localized thunderstorms producing record-breaking rainfall (Table 2).
| Table 1: June precipitation totals and departures from normal (inches) for select cities. | 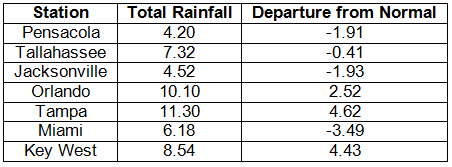 |
| Table 2. Select daily rainfall records (inches) broken during June (compiled from NOAA, NWS). | 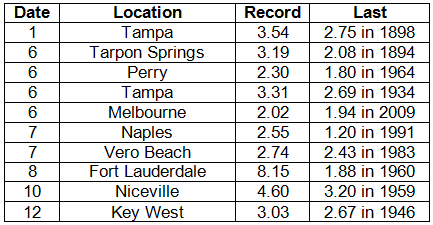 |
|
|
Figure 1. A graphical depiction of the monthly rainfall departure from normal (inches) for June is given in the figure below (courtesy of NOAA, NWS).
|  |
|
|
June CoCoRaHS Totals
|
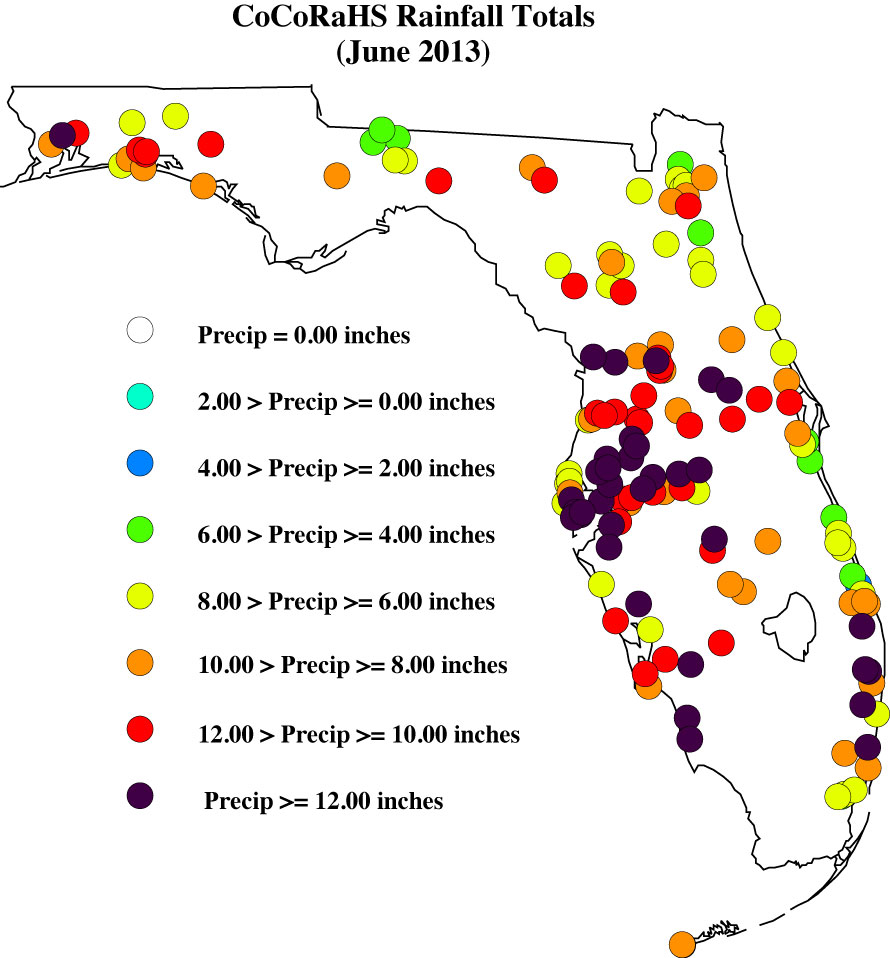
Here are the CoCoRaHS rainfall totals for June from some select CoCoRaHS stations across the state.
|
|
Current State of the Drought
|
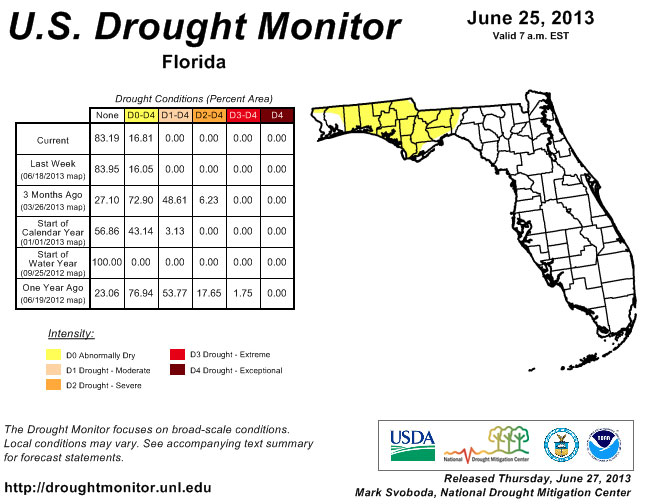
At the end of May, the lack of rainfall from the previous month in the northern part of the state prompted the re-introduction of dry conditions to Escambia, Santa Rosa, Okaloosa, Walton, Washington, Holmes and Jackson counties and an area of severe drought around the Nature Coast. The summertime rainfall pattern kicked off the beginning of June, and many stations around the state reported near or above normal rainfall for the month. The drought conditions were slowly removed during the month in the peninsula, as the area impacted by drought received 150% of monthly normal rainfall. Parts of the Panhandle continued to have issues with drought during June, though areas of moderate drought eased, the area of dry conditions expanded into the Big Bend region.
The National Drought Monitor is updated weekly, so you can always check the most recent conditions here:
http://www.drought.unl.edu/dm/DM_state.htm?FL,SE.
|
|
|
Odds and Ends
|
A few reports in Florida were flagged and required some additional information during June. I appreciate how understanding the contacted observers were, along with how quick they were to reply to my emails, though there are a few outstanding issues that need to be resolved. Please remember: if you receive an email from me with the subject line 'Question About Your Recent CoCoRaHS Observation', please take a moment to answer me back. And if you have any questions, please feel free to contact me.
Make sure to check out the monthly WxTalk Webinars offered by CoCoRaHS. Each month features a different weather-related topic and gives a chance for our observers to interact with the speaker. If you are unable to attend or have missed some of the previous month's talks, you can find them archived on the CoCoRaHS YouTube site: http://www.youtube.com/cocorahs/
Make sure to like 'Florida CoCoRaHS' on Facebook! Observers can now post comments and pictures to the wall.
| |
|
Thank You!
Thank you for your continued support and enthusiasm! If at any time you have questions about CoCoRaHS, reading your rain gauge, or finding a location to setup your rain gauge, please feel to contact a Florida CoCoRaHS Coordinator. We are lucky enough to have regional support from National Weather Service offices across the state, as well as county/local help from several CoCoRaHS volunteers.
 Melissa Griffin Florida CoCoRaHS State Coordinator Assistant State Climatologist Florida Climate Center/Center for Ocean-Atmospheric Prediction Studies Florida State University 232 R.M. Johnson Building Tallahassee, FL 32306-2840 (850) 644-0719 griffin@coaps.fsu.edu | |
|