| Quick Facts | |
1,262 Registered FL Observers
488 Active FL Observers
11,171 FL Reports Submitted during 2/13
Greatest # of Daily Reports Submitted during February: 427 on 2/14/13
Most Rainfall Reported during February: 5.87" on 2/26/13 from Station FL-BY-7
|
|
|
|
March Madness
|
If you made your daily report this morning, then you saw the notice about our annual March Madness contest. For those of you new to the network, we are running a little friendly competition at CoCoRaHS called 'March Madness' (not to be confused with the NCAA Basketball Tournament). We are trying to see which state can recruit the most observers in the month of March. North Carolina and North Dakota took home the 'CoCoRaHS Cups' last year. Even if we don't win the competition this year, I'd like to see if we can recruit at least 50 new observers in Florida this month. So if you know someone (relative or friend) who might be interested in joining the program, now would be a perfect time to get him or her to sign up.
|
|
Spring Ahead!
|
Just a friendly reminder to everyone that Daylight Saving Time begins at 2:00 AM on Sunday, March 10th. Before you go to bed the night of the 9th, make sure to turn your clock ahead by one hour to reflect the change. Just to let you know, your CoCoRaHS observations will continue to stay on local time. If your normal observation time was at 7 AM EST, it becomes 7 AM EDT after the time change. This should help avoid some confusion, but if you have questions, please feel free to drop me an email.
|
|
Feast or Famine
|
The CoCoRaHS slogans, "Every Drop Counts" and "The Rain Doesn't Fall The Same On All," were pretty evident here in Florida at the end of the month. Looking at the monthly totals across the state, gauges were either filled to capacity or collecting dust. Monthly totals ranged from 0.10" to 16.00". The 5-day rain event across portions of the Panhandle and Big Bend left many swampy yards and hopes that the rain would finally come to an end. In these regions, drought is all but gone and rivers are up, and more than a few of us are waiting for roofers to come and fix the leaks. My storm total was 11.86" from February 22nd - 26th. In addition to a significant rainfall amount (nearly 20% of the average annual total for Tallahassee), there were numerous reports of hail - a rare thing in Florida. The largest hailstones from the event were reported around Lake City, where 2" diameter hail (hen egg/lime size) broke car windows and downed tree limbs.
 | | FL-LN-2 4-day (22nd - 25th) storm total of 8.27". |
 | | Picture of hailstones taken from a neighborhood in east Tallahassee on the 24th. |
|
|
20th Anniversary of 1993 Superstorm
|
On March 12, 1993, a well-defined frontal wave rapidly intensified over the Gulf of Mexico, and, as the evening progressed, a squall line developed over the eastern part of the Gulf and moved quickly towards Florida. As the squall line approached the coast, the forward motion of the line increased to 70 mph; as it crossed the state, it produced 11 confirmed tornadoes and numerous downbursts. By the early morning hours of the 13th, the line had pushed through the entire state, including the Keys. The storm left a path of destruction in its wake as it moved through the Southeast, Mid-Atlantic and Northeast, and has gone down in history as the 'Storm of the Century' and the 'Superstorm of 1993.'
Here in Florida, wind gusts of near hurricane force were recorded at a number of locations. Tampa reported a maximum wind gust of 96 mph, Vero Beach saw a wind gust of 83 mph and the Dry Tortugas recorded a wind gust of 109 mph. Of the 11 confirmed tornadoes that touched down in Florida, 3 were of F-2 strength (in Lake, Levy and Marion counties). In addition to the wind and tornadoes, snow fell in north Florida, and several towns had unofficial estimates of up to as much of 5 inches. Numerous stations across the state reported record low temperatures for the day, and the storm surge along certain portions of the Gulf reached 6 to 12 feet.
 | | Image from the Annual Summary of the 1993 Storm Data publication. (Courtesy of the National Climatic Data Center) |
|
|
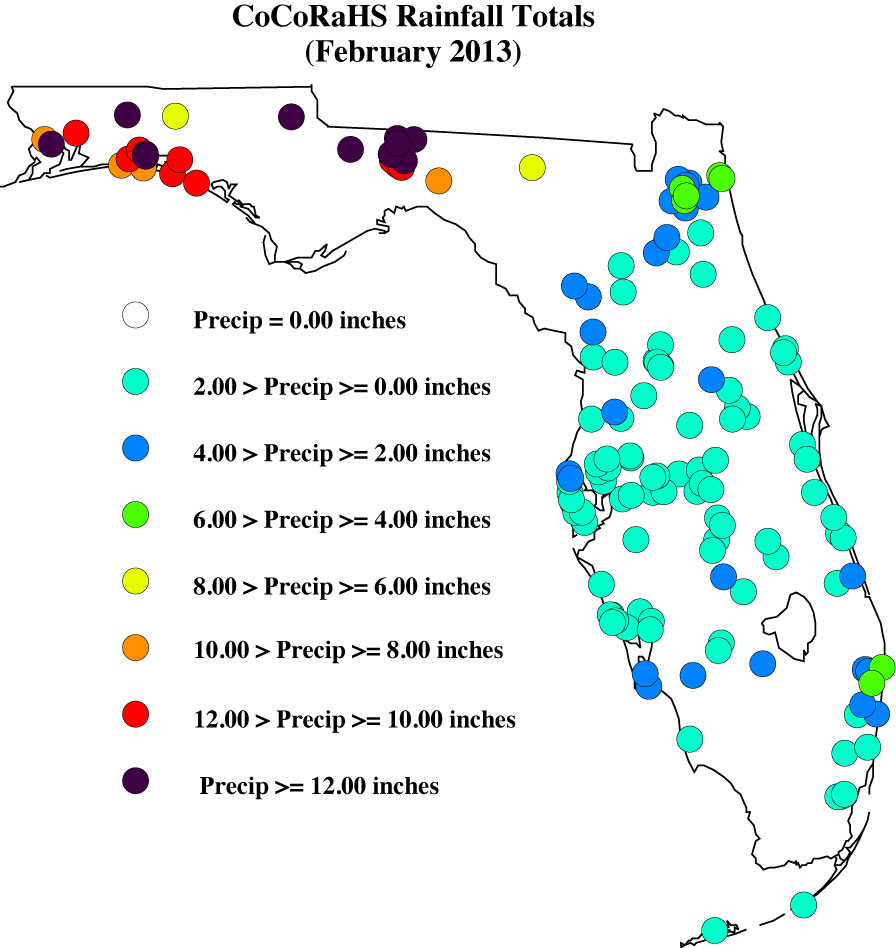
February Rains
|
Rainfall totals across the state varied in February (Table 1), with the Panhandle and Big Bend regions of the state reporting 3 to 8 inches above normal rainfall, while portions of the peninsula and south Florida were 1 to 3 inches below normal precipitation (Figure 1). February 2013 was the wettest on record for both Pensacola and Tallahassee. Multiple precipitation records were broken in February (Table 2) and three of those records were from Tallahassee during a 5-day-long significant rainfall event at the end of the month. The above normal rainfall helped eased drought conditions in some of the northern counties, but there are still drought concerns as the 3-month outlooks predict below normal rainfall for the spring dry season.
| Table 1: February precipitation totals and departures from normal (inches) for select cities. | 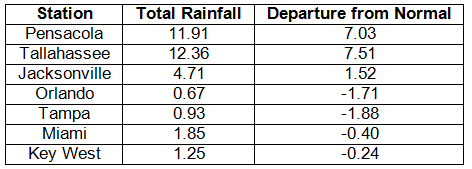 |
| Table 2. Select daily rainfall records (inches) broken during February (Compiled from NOAA, NWS). | 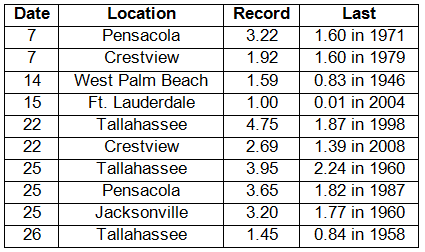 |
|
|
Figure 1. A graphical depiction of the monthly rainfall departure from normal (inches) for February is given in the figure below (courtesy of NOAA, NWS).
| 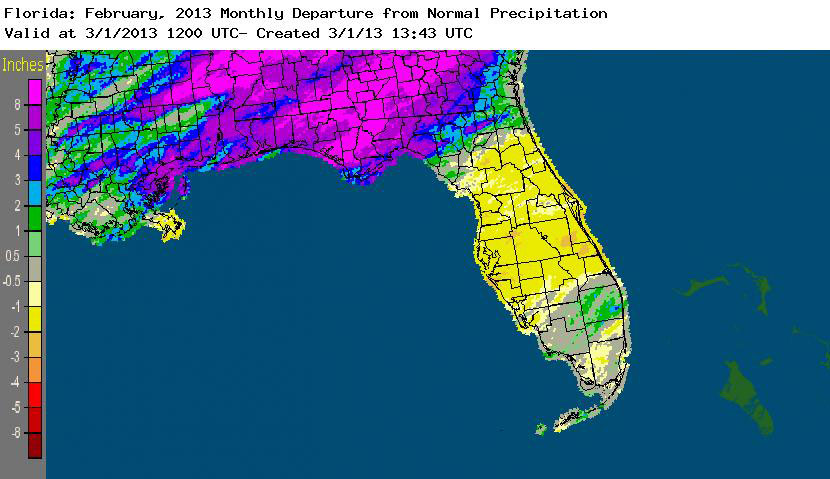 |
|
|
February CoCoRaHS Totals
|
Here are the CoCoRaHS rainfall totals for February from some select CoCoRaHS stations across the state.
|
|
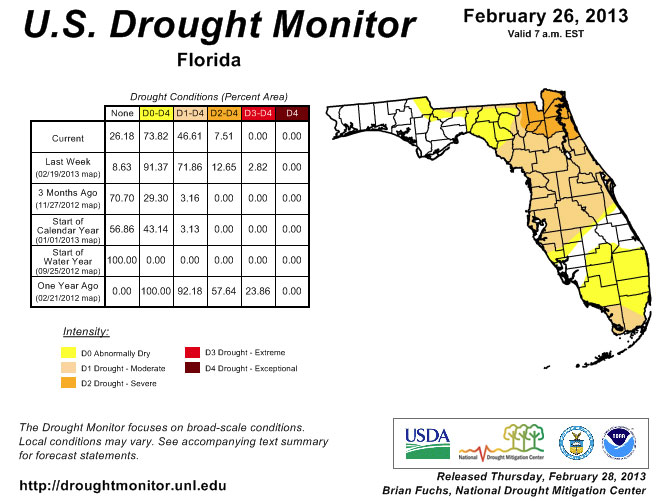
Current State of the Drought
|
Statewide rainfall totals varied greatly across the state during February. Comparing the January 29th release of the drought monitor to the one that was posted on February 26th only tells part of the drought story in Florida. In the first week of the month, additional areas of D1 (moderate drought) were added to coastal portions of Dade, Monroe and Palm Beach counties; while the rest of the state remained unchanged. That area was expanded on the 12th to include all of Monroe County and most of Dade County and was extended north from Palm Beach County into Broward County. By the time the Drought Monitor was posted on the 19th, things had drastically changed. The area of the state that was covered by D1 had expanded from 36% to 72%, and a small area of D3 (extreme drought) had been added along the Florida and Georgia state line. The only parts of the state that remained drought free were portions of Charlotte, Lee, Glades, Highlands, Okeechobee, Indian River, St. Lucie and Martin counties. Things rapidly changed toward the end of February after torrential rains inundated portions of the Panhandle and Big Bend. The rains managed to ease the moderate and severe drought conditions in a lot of the counties in this region. Most of the major rivers are at or above flood stage, and there are reports that wells are coming up as some of this heavy rain makes it into the water table. Despite some of the state receiving the needed rain, the rest of North Florida and the Peninsula are still dealing with drought conditions as we start to transition to the spring dry season.
The National Drought Monitor is updated weekly, so you can always check the most recent conditions here:
http://www.drought.unl.edu/dm/DM_state.htm?FL,SE.
|
|
|
Odds and Ends
|
A few reports in Florida were flagged and required some additional information during February. I appreciate how understanding the contacted observers were, along with how quick they were to reply to my emails, though there are a few outstanding issues that need to be resolved. Please remember: if you receive an email from me with the subject line 'Question About Your Recent CoCoRaHS Observation', please take a moment to answer me back. And if you have any questions, please feel free to contact me.
Make sure to check out the monthly WxTalk Webinars offered by CoCoRaHS. Each month features a different weather-related topic and gives a chance for our observers to interact with the speaker. If you are unable to attend or have missed some of the previous month's talks, you can find them archived on the CoCoRaHS YouTube site: http://www.youtube.com/cocorahs/
| |
|
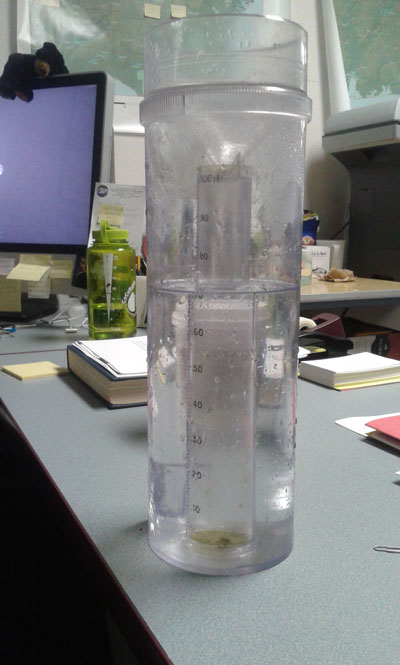
Thank You!
Thank you for your continued support and enthusiasm! If at any time you have questions about CoCoRaHS, reading your rain gauge, or finding a location to setup your rain gauge, please feel to contact a Florida CoCoRaHS Coordinator. We are lucky enough to have regional support from National Weather Service offices across the state, as well as county/local help from several CoCoRaHS volunteers.
 Melissa Griffin Florida CoCoRaHS State Coordinator Assistant State Climatologist Florida Climate Center/Center for Ocean-Atmospheric Prediction Studies Florida State University 232 R.M. Johnson Building Tallahassee, FL 32306-2840 (850) 644-0719 griffin@coaps.fsu.edu | |
|