Dear Florida Climate Center Friends,
We'd like to take this time to wish you a Happy New Year and to present you with the February 2013 edition of our newsletter. In this newsletter, you'll find our monthly climate summary, a list of special events that our staff attended, an example of a data request made to the office, and more. If you have any questions, please email us at climate@coaps.fsu.edu.
Thanks,
The Staff of the Florida Climate Center
 |  |  | David Zierden
State Climatologist | James O'Brien
Professor Emeritus | Melissa Griffin
Asst. State Climatologist |
|
|
Groundhog Day 2013
On February 2nd, Punxsutawney Phil, the world's most famous weather forecasting groundhog, will make his prediction for the upcoming spring. Will we see an early spring or will we be subjected to six more weeks of winter?
Since 1886, the groundhog has only predicted an early spring 16 times. If you are interested in predictions of temperature and precipitation over the next two weeks or out three months, NOAA's Climate Prediction Center has a variety of maps that you can view to see what are the forecasted trends. The maps are available on their homepage at: http://www.cpc.ncep.noaa.gov/.
|
January Climate Summary for Florida
The Florida Climate Center's January 2013 Florida Climate Summary is now available. The summary provides an analysis of temperature and precipitation trends across the state, along with data on hazardous weather, drought, the impacts of the weather and any records tied or broken for the month. During January, average temperatures were above normal while rainfall totals were below normal in Florida. ENSO-neutral conditions are expected to continue through the spring. The Climate Prediction Center (CPC) predicts normal temperatures for Florida through April and below normal precipitation in the western Panhandle and north Florida. Past summaries are archived here.
| January average temperatures and departures from normal (° F) for select cities. | 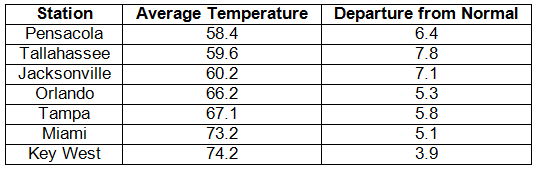 |
| January precipitation totals and departures from normal (inches) for select cities. | 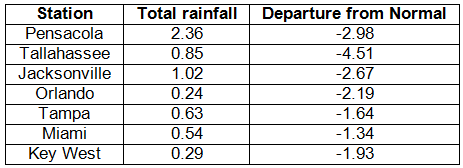 |
| A graphical depiction of the monthly rainfall departure from normal (inches) for January (courtesy of NOAA, NWS). | 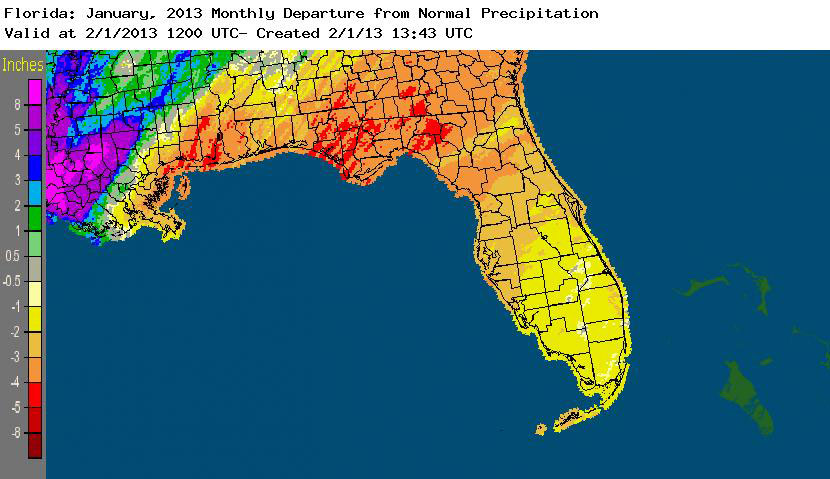 |
|
|
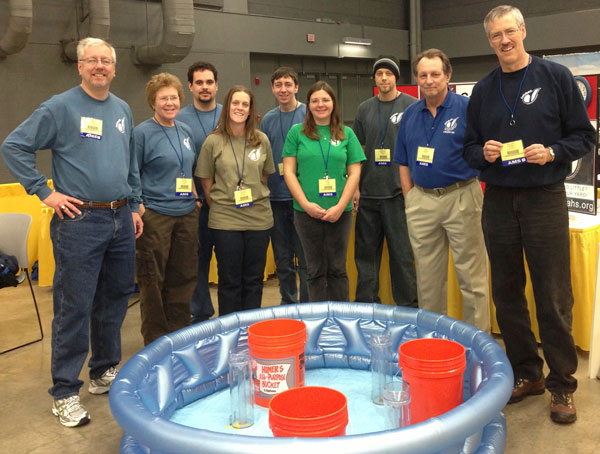 American Meteorological Society Meeting in Austin American Meteorological Society Meeting in Austin
Assistant State Climatologist Melissa Griffin started off 2013 by attending the 91st Annual Meeting of the American Meteorological Society (AMS) in Austin, TX. During her 5-day stay in the Texas capital, Ms. Griffin took part in the AMS WeatherFest Event, which allows people from the surround community to come and experience a variety of interactive weather and science exhibits. As state coordinator for the Community Collaborative Rain, Hail and Snow Network (CoCoRaHS), she helped out at their exhibit and helped attendees learn how to measure rainfall.
In addition to volunteering during WeatherFest, Ms. Griffin also presented at the 20th Conference on Applied Climatology, which was held in conjunction with the AMS Annual Meeting. Her presentation entitled 'Developing a Localized Climate Extremes Index for Individual States' is ongoing work done with Ms. Adrienne Wootten at North Carolina State University. The purpose of the research is to develop an index that is localized to the impacts in any given state and includes information on the historical extremes of severe weather, tropical activity and winter weather in addition to impacts of extreme temperatures and precipitation.
|
|
State Climatologist Addresses Regional Dairy Farmers
The Southern Land Grant Universities sponsored the 39th annual Southern Dairy Conference on January 22 and 23rd in Atlanta, Georgia. The program was packed with informative presentations on topics important to dairy farming and production, including farm policy, market outlooks, and economics and crop insurance. Florida State Climatologist David Zierden was included in the program and presented on climate variability, the El Nino/La Nina cycle and how it impacts southern climate, and current conditions and the outlook for the upcoming spring and growing season. With the Pacific Ocean in the neutral phase this year, the southern states can expect a more normal spring, with more variable weather patterns. The presentations will be available online and more information about the conference can be found at: http://www.southerndairyconference.com/.
|
|
Skype Presentation with School
On January 24th and 25th, Assistant State Climatologist Melissa Griffin gave two unique presentations to 6th graders at the Sarasota School of Arts and Science in Sarasota, FL. They joined the GLOBE program earlier in the school year and were beginning to start their projects, but the students needed to be able to easily access weather data and information. Since Ms. Griffin was unable to travel, she and Mrs. Lauren Watson set up an interactive Skype presentation that allowed Ms. Griffin to show the students the variety of data on the center's webpage, and instructed them how to use the data tools. The students listened to a presentation, asked and answered several climate related questions, and then asked Ms. Griffin a few questions of their own.
|
|
Children's Day
Assistant State Climatologist Melissa Griffin took part in the Museum of Florida History's Children's Day outreach event on January 26th. Along with undergraduate assistant Lauren Zuromski and fellow Deep-C and COAPS colleagues Meredith Field and Amelia Vaughan, Ms. Griffin demonstrated how clouds form, illustrated the power of wind with mini air cannons made from coffee cups, and quizzed attendees with Florida Climate Trivia game.
|
|
Upcoming Events
February 8, 2013:
Climate Adaptation Fair in Tifton, GA
February 15, 2013:
Wiregrass Cotton Expo in Dothan, AL
February 16, 2013:
National High Magnetic Field Lab Open House in Tallahassee, FL
February 22, 2013:
Row Crop Climate Learning Network in Live Oak, FL
March 5-7, 2013:
Southeast Regional Climate Center Technical Advisory Committee Meeting in Key West, FL
March 16, 2013:
Science Saturday in the Park at Railroad Square Art Park in Tallahassee, FL
|
|
Example Data Request
Each month, we highlight here recent examples of some of the many public services provided by the Florida Climate Center:
This winter has had more than a few people befuddled as to why the temperatures have been so mild, only to be followed by a couple of days of colder highs and lows. One such citizen from Orlando contacted the FCC earlier this month looking for answers to this question. Overall, the past few winters have been influenced by El Nino Southern Oscillation (ENSO), which can help increase the likelihood of wet/cool winters in an El Nino, or make our winters warm/dry in a La Nina across Florida. There have been a few times (2009-2010 and 2010-2011) when the Arctic Oscillation made for a few extremely cold periods in recent winters. This year, things are different: we have a Neutral phase of ENSO, which means anything goes! Neutral winters are marked with more variable winter patterns, with periods of very cold weather mixed in with warm spells. So, what we are seeing so far this winter is something we would expect without having ENSO to modify our weather patterns. However, at the beginning of 2013 it had been very warm across the state, with numerous maximum temperatures broken in Florida and along portions of the eastern seaboard, while out west, they were reporting record cold. Part of this was due to the amplified jet stream pattern that had set up across the United States. There are a couple of public access tools available to look at the historical perspective of temperature and precipitation data. The first is the interactive map from the National Climatic Data Center (NCDC) that plots all of the record temperatures and precipitation events across the U.S: http://www.ncdc.noaa.gov/extremes/records/ Another interesting map is the Climate Perspectives Map from the Southeast Regional Climate Center. This map only shows data for states within its region (VA, NC, SC, GA, FL, and AL), but it's a very powerful tool. You can access the system here: http://www.sercc.com/perspectives Click on 'Regional Map Perspectives' and you will see a variety of drop down menus appear on the right hand side. From them you can chose the variable of interest, averages or thresholds, a period of record based on a date, and then whether or not the map will display the values, rankings or departure from normal at each station within the database. You can then click on a station and get a little more detailed information. |
|
About Us
The Florida Climate Center is part of a three-tiered system of national, regional, and state climate offices, including NOAA's National Climatic Data Center and the Southeast Regional Climate Center. The Florida State Climatologist and other staff at the Florida Climate Center provide the following information and services to the people of Florida:
· Climate Data:
Historical weather observations for weather stations throughout the state of Florida. We are able to provide data for most stations from 1948-present.
· Climate Information:
Long-term historical averages for various stations, climate divisions, and the entire state.
· Extreme Event Records:
Information and analyses on extreme events such as freezes, droughts, floods and hurricanes.
· Special Analysis:
With their vast knowledge of El Niño, La Niña and climate variability, the State Climatologist and staff can offer expert insight into Florida's climate trends.
· Outreach:
Activities, presentations, and workshops that inform and educate the people of Florida about current and emerging climate issues. We also coordinate volunteers for the Community Collaborative Rain, Hail & Snow Network (CoCoRaHS).
More About Us
|
|