|
Volume 2012/13, Issue 6
| January 15, 2013 |
|

Honolulu Bar Re-vegetation:
January 26
31st Annual Salmonid Restoration Conference:
March 13-16
47th Annual Cal-Neva Conference:
April 4-6
|
|

|
Key Highlights
December 17, 2012 - January 6, 2013
Calaveras River Juvenile Migration Monitoring continued at the Shelton Road (RM 28) rotary screw trap and a total of 21 O. mykiss were captured, increasing the
season total to 75.
Stanislaus River Juvenile Migration Monitoring at Oakdale (RM 40) began on January 1, and a total of 2,273 Chinook salmon fry and 3 O. mykiss were captured. Monitoring at Caswell (RM 4) began on December 17, and a total of 51 Chinook salmon and 10 O. mykiss were captured.
Tuolumne River Juvenile Migration Monitoring at Waterford (RM 30) and at Grayson (RM 5) began on January 2. No Chinook salmon were captured.
Mokelumne River Juvenile Migration Monitoring at Vino Farms (RM 54) began on December 17 and a total of 736 Chinook salmon were captured.
Stanislaus River Weir Monitoring continued with a total of 23 Chinook salmon passing upstream through the weir between December 17 and January 6, increasing the total to 7,042.
Tuolumne River Weir Monitoring continued with a total of 30 Chinook salmon passing upstream through the weir between December 17 and January 6, increasing the total to 2,105.
Mokelumne River Woodbridge Dam Fish Ladder Monitoring continued with a total of 13 Chinook salmon passed upstream of the dam between December 17 and January 6, increasing the total to 12,088.
San Joaquin Basin Escapement Surveys. Annual carcass surveys conducted by California Department of Fish and Game (CDFG) continued through the week of December 31 and spawning activity has been decreasing since the peak in mid-November.
San Joaquin River Conditions. San Joaquin River flow at Vernalis ranged from 1,365 cfs to 3,507 cfs. Daily average water temperature in the San Joaquin River ranged from 45.6°F to 50.7°F at Vernalis, and from 46.1°F to 50.7°F at Mossdale. Daily average dissolved oxygen (DO) in the San Joaquin River ranged from 9.7 mg/L to 11.1 mg/L at Mossdale, and from 7.0 mg/L to 9.9 mg/L in the deep-water ship channel (measured at Rough 'n Ready Island).
Delta Exports. Combined total exports (state and federal pumps) fluctuated during the reporting period, ranging from 1,547 cfs to 11,205 cfs.
|
|
2011/12 Calaveras River Juvenile Migration Monitoring
The Calaveras River rotary screw trap at Shelton Road (RM 28) operated twelve days between December 17 and January 6 and a total of 21 O. mykiss were captured, increasing the total to 75. Daily catches ranged from zero to five individuals (Figure 1), and all O. mykiss captured were Age 1+ (100-299 mm) and were rated as parr (n=1), silvery parr (n=16) and smolt (n=2). Average forklengths and weights of O. mykiss are provided in Table 1. No Chinook salmon were captured during this reporting period. The season total remains at two. Instantaneous temperature recorded at the trap ranged from 42.9ºF to 52.1ºF, and turbidity ranged from 0.94 NTU to 9.97 NTU. During the reporting period, daily average combined flow from New Hogan Dam (NHG) and Cosgrove Creek (COS) fluctuated between 23 cfs and 103 cfs, and at Bellota (MRS) flow fluctuated between 2 cfs and 241 cfs (Figure 1). Table 1. Biosampling data for O. mykiss captured at Shelton Road between December 17, 2012 and January 6, 2013. Parenthesis indicates range.
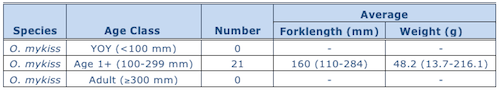 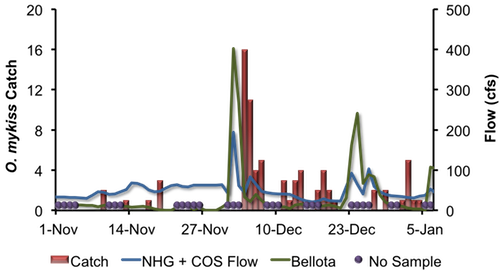
Figure 1. Daily O. mykiss catch at Shelton Road, and Calaveras River flow recorded by New Hogan Dam (NHG) and Cosgrove Creek (COS) combined and flow recorded at Bellota (MRS), in 2012 and 2013.
|
2011/12 Stanislaus River Juvenile Migration Monitoring
The Stanislaus River rotary screw trap at Oakdale (RM 40) began on January 1 and operated continuously through the end of the reporting period. A total of 2,273 Chinook salmon were captured during the reporting period. Average forklengths and weights of all Chinook salmon are provided in Table 2. Most of the fish measured were fry (n = 361), but one captured Chinook salmon was greater than 100 mm and rated a smolt.
Table 2. Biosampling data for Chinook salmon captured and measured at Oakdale between January 1 and January 6, 2013. Parentheses indicate range.
 Three O. mykiss were captured during the reporting period and rated as silvery parr (n=1) and smolt (n=2). Three O. mykiss were captured during the reporting period and rated as silvery parr (n=1) and smolt (n=2).
Instantaneous temperature taken at the trap ranged from 46.5ºF to 49.4ºF, and turbidity ranged from 3.76 NTU to 7.80 NTU. Daily average flow at Goodwin Dam (GDW) ranged from 279 cfs to 299 cfs, and flow ranged from 332 cfs to 391 cfs at Ripon (RIP) (Figure 2).
One trap efficiency experiment was conducted during the reporting period with naturally spawned juvenile Chinook salmon marked caudal fin green (CFG). The preliminary estimated capture efficiency was 6.8% at a flow of 284 cfs (Table 3).
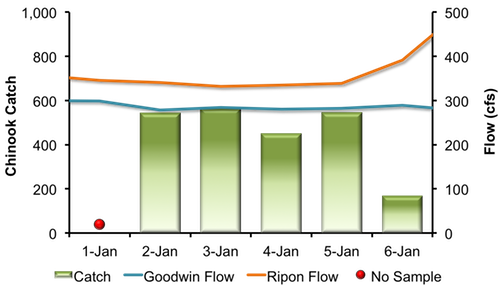 Figure 2. Daily Chinook salmon catch at Oakdale and Stanislaus River flow recorded at Goodwin Dam (GDW) and Ripon (RIP) in 2013. The Stanislaus River rotary screw traps at Caswell (RM 4) began operating December 17 and sampled for 21 days through January 12. A total of 50 Chinook salmon fry and one smolt were captured. One O. mykiss was captured (218 mm). Instantaneous temperature taken at the trap ranged from 44.8ºF to 50.4ºF, and instantaneous turbidity ranged from 1.51 NTU to 31.70 NTU. Instantaneous dissolved oxygen measured at the trap ranged from 11.03 mg/L to 14.55 mg/L.
|
2012 Tuolumne River Juvenile Migration Monitoring
The Tuolumne River rotary screw trap at Waterford (RM 30) began operating on January 2 and no Chinook salmon or O. mykiss were captured during the reporting period.
Instantaneous temperature taken at the trap ranged from 46.2ºF to 48.0ºF, and turbidity ranged from 1.42 NTU to 6.22 NTU. Daily average flow at La Grange (LGN) was stable between 170 cfs and 178 cfs (Figure 3).
No trap efficiency experiments were conducted during the reporting period.  Figure 3. Daily Chinook salmon catch at Waterford and Tuolumne River flow recorded at La Grange (LGN) and Modesto (MOD) between December 1, 2012, and January 6, 2013.  The Tuolumne River rotary screw traps at Grayson (RM 5) began operating on January 2. No Chinook salmon were captured during the reporting period. The Tuolumne River rotary screw traps at Grayson (RM 5) began operating on January 2. No Chinook salmon were captured during the reporting period. Instantaneous temperature taken at the trap ranged from 44.0ºF to 47.8ºF, and turbidity ranged from 3.12 NTU to 9.13 NTU. Daily average flow at Modesto (MOD) fluctuated during the reporting period due to a couple freshet events, ranging between 212 cfs and 1,400 cfs.
|
2011/12 Mokelumne River Juvenile Migration Monitoring
The Mokelumne River rotary screw trap at Vino Farms (RM 54) began on December 17 and was sampled intermittently during the reporting period. A total of 736 juvenile Chinook salmon were captured.
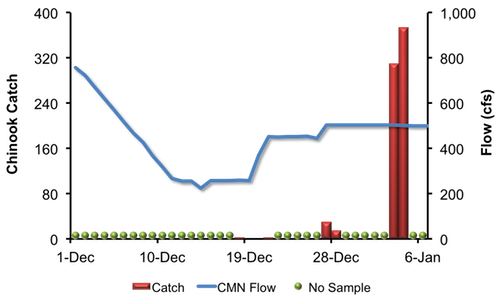
Average daily flow from Camanche Reservoir (CMN) ranged from 258 cfs to 503 cfs (Figure 4). Instantaneous temperature ranged between 49.5°F and 53.8°F, and instantaneous turbidity ranged between 2.09 NTU and 6.68 NTU.
Figure 4. Daily juvenile Chinook catches at Vino Farms and Mokelumne River flow recorded at Camanche Reservoir (CMN), between December 1, 2012, and January 6, 2013.
|
2011 Stanislaus River Weir Adult Migration Monitoring
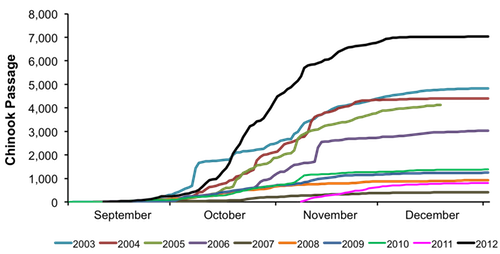
Between December 17 and January 6 a total of 23 Chinook salmon were detected by the Vaki Riverwatcher as they passed upstream of the Stanislaus River weir. The total passage to-date of 7,042 is the highest observed at the Stanislaus weir since monitoring began in 2003 (Figure 5; Table 4). Daily passage has decreased during the reporting period, ranging between 0 and 5 Chinook salmon (Figure 6).
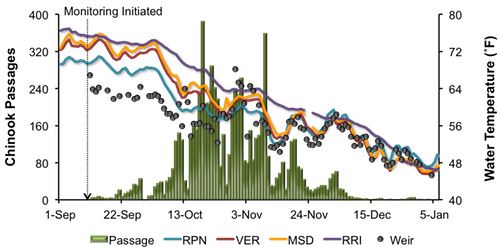
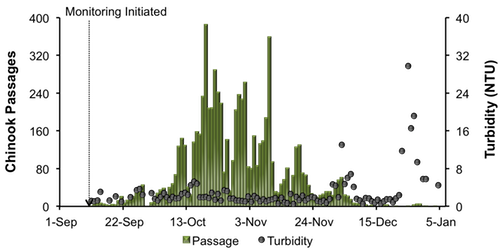
Instantaneous water temperature measured at the weir ranged between 45.3˚F and 52.7˚F, and daily average water temperature at Ripon (RPN; RM 15) ranged between 47.1˚F and 52.8˚F (Figure 7). Instantaneous turbidity ranged between 0.9 NTU and 106.0 NTU (Figure 8). Instantaneous dissolved oxygen at the weir ranged between 10.30 mg/L and 13.28 mg/L, and daily average dissolved oxygen at Ripon (RPN; RM 15) ranged from 9.16 mg/L to 10.60 mg/L (Figure 9).
Daily average flows in the Stanislaus River at Goodwin Dam (GDW; RM 58) ranged from 278 cfs to 318 cfs. Flows at Ripon (RIP; RM 15) ranged from 315 cfs to 705 cfs. Note: flows downstream of Goodwin Dam may differ from dam releases due to irrigation, precipitation and other factors.
Table 4. Annual fall-run Chinook passage at the Stanislaus River weir prior to January 6, 2003-2012.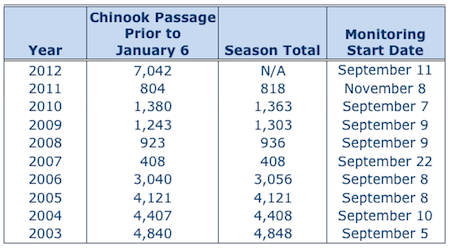
Figure 5. Cumulative passage of fall-run Chinook salmon recorded at the Stanislaus River weir from 2003-2012.
Figure 6. Daily upstream Chinook passage at the Stanislaus River weir in relation to daily average flows (cfs) recorded in the Stanislaus River at Goodwin (GDW) and Ripon (RIP), 2012. Figure 7. Daily upstream Chinook passage recorded at the Stanislaus River weir in relation to instantaneous water temperature recorded at the weir, and daily average water temperature recorded in the Stanislaus River at Ripon (RPN), and in the San Joaquin River at Vernalis (VER), Mossdale (MSD) and Rough & Ready (RRI) in 2012. Figure 8. Daily upstream Chinook passage at the Stanislaus River weir in relation to instantaneous turbidity recorded at the weir in 2012. (Note: Turbidity on December 24 was measured at 106.0 NTU.) Figure 9. Daily upstream Chinook passage at the Stanislaus River weir in relation to instantaneous dissolved oxygen recorded at the weir, and daily average dissolved oxygen recorded in the Stanislaus River at Ripon (RPN), and in the San Joaquin River at Mossdale (MSD) and Rough & Ready (RRI) in 2012.
|
2011 Tuolumne River Weir Adult Migration Monitoring
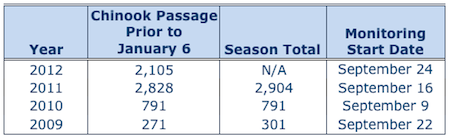
Between December 17 and January 6 a total of 30 Chinook salmon were detected by the Vaki Riverwatcher as they passed upstream of the Tuolumne River weir. Total  passage to-date of 2,105 is less than the 2,828 passages observed in 2011 at the Tuolumne weir (Figure 10; Table 5). Daily passage decreased during the reporting period, ranging between 0 and 10 Chinook salmon (Figure 11).
Daily average flow in the Tuolumne River ranged from 170 cfs to 178 cfs at La Grange (LGN; RM 50) and 211 cfs and 1,400 cfs at Modesto (MOD; RM 17). Note: flows downstream of La Grange may be higher than dam releases due to accretion and Dry Creek inflow.
Instantaneous water temperature measured at the weir ranged between 46.2˚F and 51.2˚F and daily average water temperature at Modesto (MOD; RM 17) ranged between 46.6˚F and 51.6˚F (Figure 12). Instantaneous turbidity ranged between 0.56 NTU and 10.17 NTU (Figure 13), and instantaneous dissolved oxygen ranged between 11.52 mg/L and 13.60 mg/L (Figure 14).
Table 5. Annual Fall-run Chinook passage prior to January 6, 2009 - 2012.
Figure 10. Fall-Run Chinook salmon cumulative passage recorded at the Tuolumne River Weir in 2009 - 2012.

Figure 11. Daily upstream Chinook passage at the Tuolumne River Weir in relation to daily average flows (cfs) recorded in the Tuolumne River at La Grange (LGN) and Modesto (MOD), and in the San Joaquin River at Vernalis (VNS) in 2012.
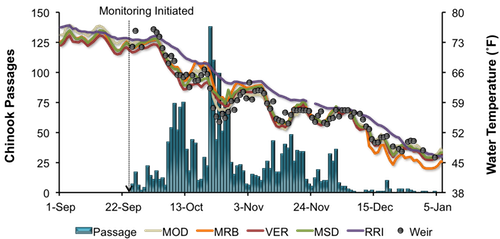
Figure 12. Daily upstream Chinook passage at the Tuolumne River Weir in relation to instantaneous water temperature recorded at the weir, and daily average water temperature recorded in the Tuolumne River at Modesto (MOD) and in the San Joaquin River at Vernalis (VER), Mossdale (MSD) and Rough & Ready (RRI) in 2012.
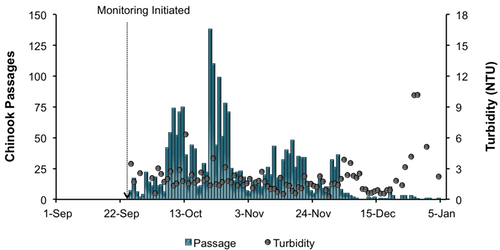
Figure 13. Daily upstream Chinook passage at the Tuolumne River Weir in relation to instantaneous turbidity recorded at the weir in 2012.

Figure 14. Daily upstream Chinook passage at the Tuolumne River Weir in relation to instantaneous dissolved oxygen recorded at the weir, and daily average dissolved oxygen recorded in the San Joaquin River at Mossdale (MSD) and Rough & Ready (RRI) in 2012.
|
Mokelumne River Woodbridge Dam Fish Ladder Monitoring Fall-run Chinook salmon returning to the Mokelumne are counted annually by East Bay Municipal Utility District (EBMUD) as they ascend the fish ladder at Woodbridge Dam. A total of 13 Chinook salmon were observed passing upstream of the dam between December 17 and January 6, increasing the total for the season to 12,088. Daily passage ranged between 0 and 2 Chinook (Figure 15). Daily average flow in the Mokelumne River fluctuated between 258 and 503 cfs at Camanche Reservoir (CMN) and between 141 cfs and 380 cfs at Woodbridge Dam (WBR). 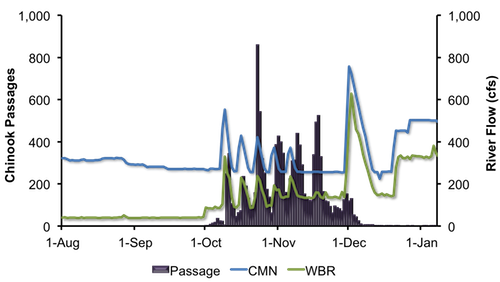
Figure 15. Daily upstream Chinook passage recorded at the Woodbridge Dam fish ladder in relation to daily average flows (cfs) recorded in the Mokelumne River at Camanche Reservoir (CMN) in 2012.
|
San Joaquin Basin Escapement Surveys Annual carcass surveys conducted by CDFG continued through the week of December 31. The number of live fish and redds observed on all rivers continued to decrease during recent weeks since peak spawning in mid-November. Live counts during the week of December 31st were 0 on the Stanislaus River, 0 on the Tuolumne River and 3 on the Merced River. A total of 299 females were spawned at the Merced River Fish Facility (MRFF) as of December 30, compared to a total of only 73 in 2011.
|
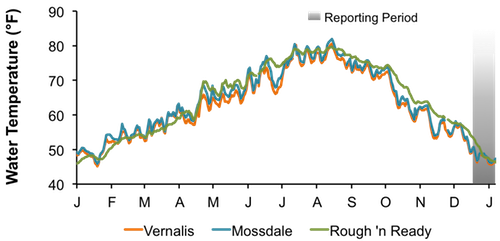
San Joaquin River Conditions During the reporting period, flow in the San Joaquin River at Vernalis fluctuated from 1,365 cfs to 3,507 cfs (Figure 16). Water temperature in the San Joaquin River ranged from 45.6°F to 50.7°F at Vernalis, from 46.1°F to 50.7°F at Mossdale, and from 46.5°F to 53.6°F at Rough 'n Ready Island (Figure 17). Average daily dissolved oxygen (DO) in the San Joaquin River fluctuated from 7.0 mg/L to 9.9 mg/L in the deep-water ship channel (measured at Rough 'n Ready Island), and from 9.7 mg/L to 11.1 mg/L at Mossdale (Figure 18). 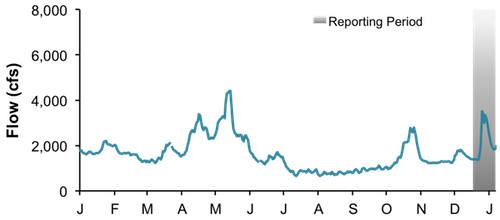
Figure 16. San Joaquin River flow at Vernalis from January 1, 2012, through January 6, 2013.
Figure 17. San Joaquin River daily average water temperature at Vernalis, Mossdale, and Rough 'n Ready from January 1, 2012, through January 6, 2013.
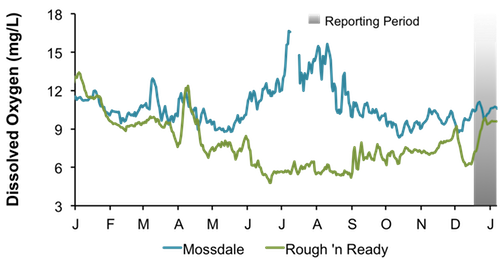
Figure 18. San Joaquin River daily average dissolved oxygen at Mossdale and Rough 'n Ready, from January 1, 2012, through January 6, 2013.
|
Delta Exports
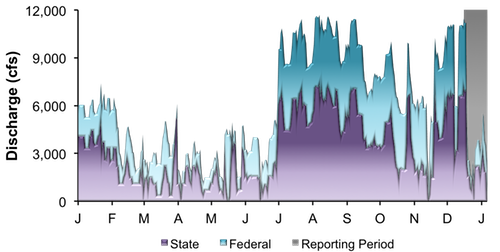
Mean daily pumping at the C.W. Jones Pumping Plant (federal pumps previously known as Tracy Pumping Plant) ranged from 817 cfs to 4,357 cfs (Figure 16). Mean daily pumping at the Harvey O. Banks Pumping Plant (state pumps) ranged from 59 cfs to 6,974 cfs. Combined total exports (state and federal pumps) during this period ranged from 1,547 cfs to 11,205 cfs.
Figure 19. Daily exports at the state and federal pumping stations from January 1, 2012, through January 6, 2013.
|
|
|
|
|
|
|