|
Volume 2012, Issue 5
| December 26, 2012 |
|

Honolulu Bar Re-vegetation:
January 26
31st Annual Salmonid Restoration Conference:
March 13-16
47th Annual Cal-Neva Conference:
April 4-6
|
|
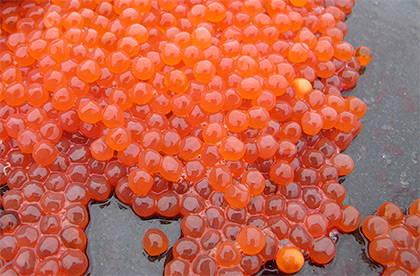
Photo by FISHBIO |
Key Highlights
December 3 - December 16, 2012
Stanislaus River Weir Monitoring continued with a total of 150 Chinook salmon passing upstream through the weir between December 3 and December 16, increasing the total to 7,019.
Tuolumne River Weir Monitoring continued with a total of 30 Chinook salmon passing upstream through the weir between December 3 and December 16, increasing the total to 2,075.
Mokelumne River Woodbridge Dam Fish Ladder Monitoring continued with a total of 169 Chinook salmon passing upstream of the dam between December 3 and December 16, increasing the total to 12,075.
San Joaquin Basin Escapement Surveys. Annual carcass surveys conducted by California Department of Fish and Game (CDFG) continued through the week of December 10, and spawning activity has been decreasing since the peak in mid-November.
Calaveras River Juvenile Migration Monitoring continued at the Shelton Road (RM 28) rotary screw trap and a total of 47 O. mykiss and one Chinook salmon yearlingwere captured during the reporting period, increasing the season total to 54 and 2, respectively.
San Joaquin River Conditions. San Joaquin River flow at Vernalis ranged from 1,400 cfs to 1,809 cfs. Daily average water temperature in the San Joaquin River ranged from 48.9°F to 57.2°F at Vernalis, and from 49.3°F to 57.5°F at Mossdale. Daily average dissolved oxygen (DO) in the San Joaquin River ranged from 8.8 mg/L to 10.5 mg/L at Mossdale, and from 6.1 mg/L to 8.3 mg/L in the deep-water ship channel (measured at Rough 'n Ready Island).
Delta Exports. Combined total exports (state and federal pumps) fluctuated during the reporting period, ranging from 5,920 cfs to 11,484 cfs.
|
|
2012 Stanislaus River Weir Adult Migration Monitoring
Between December 3 and December 16 a total of 150 Chinook salmon were detected by the Vaki Riverwatcher as they passed upstream of the Stanislaus River weir. The  total passage to-date of 7,019 is the highest observed at the Stanislaus weir since monitoring began in 2003 (Figure 1; Table 1). Daily passage has decreased during the reporting period, ranging between 0 and 61 Chinook salmon (Figure 2). total passage to-date of 7,019 is the highest observed at the Stanislaus weir since monitoring began in 2003 (Figure 1; Table 1). Daily passage has decreased during the reporting period, ranging between 0 and 61 Chinook salmon (Figure 2).
Instantaneous water temperature measured at the weir ranged between 48.7˚F and 58.4˚F, and daily average water temperature at Ripon (RPN; RM 15) ranged between 50.2˚F and 58.4˚F (Figure 3). Instantaneous turbidity ranged between 0.58 NTU and 13.04 NTU (Figure 4). Instantaneous dissolved oxygen at the weir ranged between 8.86 mg/L and 11.36 mg/L, and daily average dissolved oxygen at Ripon (RPN; RM 15) ranged from 8.20 mg/L to 10.10 mg/L (Figure 5).
Daily average flows in the Stanislaus River at Goodwin Dam (GDW; RM 58) ranged from 276 cfs to 288 cfs. Flows at Ripon (RIP; RM 15) ranged from 314 cfs to 472 cfs. Note: flows downstream of Goodwin Dam may differ from dam releases due to irrigation, precipitation and other factors.
Table 1. Annual fall-run Chinook passage at the Stanislaus River weir prior to December 16, 2003-2012.
Figure 1. Cumulative passage of fall-run Chinook salmon recorded at the Stanislaus River weir from 2003-2012. (Note: Sampling in 2011 began on November 8th, which is later than usual.) Figure 2. Daily upstream Chinook passage at the Stanislaus River weir in relation to daily average flows (cfs) recorded in the Stanislaus River at Goodwin (GDW) and Ripon (RIP), 2012. Figure 3. Daily upstream Chinook passage recorded at the Stanislaus River weir in relation to instantaneous water temperature recorded at the weir, and daily average water temperature recorded in the Stanislaus River at Ripon (RPN), and in the San Joaquin River at Vernalis (VER), Mossdale (MSD) and Rough & Ready (RRI) in 2012.
Figure 4. Daily upstream Chinook passage at the Stanislaus River weir in relation to instantaneous turbidity recorded at the weir in 2012. Figure 5. Daily upstream Chinook passage at the Stanislaus River weir in relation to instantaneous dissolved oxygen recorded at the weir, and daily average dissolved oxygen recorded in the Stanislaus River at Ripon (RPN), and in the San Joaquin River at Mossdale (MSD) and Rough & Ready (RRI) in 2012.
|
2012 Tuolumne River Weir Adult Migration Monitoring
Between December 3 and December 16 a total of 30 Chinook salmon were detected by the Vaki Riverwatcher as they passed upstream of the Tuolumne River weir. The  total passage to-date of 2,075 is slightly lower than the 2,612 passages observed in 2011 at the Tuolumne weir (Figure 6; Table 2). Daily passage decreased during the reporting period, ranging between 0 and 8 Chinook salmon (Figure 7). total passage to-date of 2,075 is slightly lower than the 2,612 passages observed in 2011 at the Tuolumne weir (Figure 6; Table 2). Daily passage decreased during the reporting period, ranging between 0 and 8 Chinook salmon (Figure 7).
Daily average flow in the Tuolumne River ranged from 177 cfs to 178 cfs at La Grange (LGN; RM 50) and 211 cfs and 294 cfs at Modesto (MOD; RM 17). Note: flows downstream of La Grange may be higher than dam releases due to accretion and Dry Creek inflow.
Instantaneous water temperature measured at the weir ranged between 49.6˚F and 57.2˚F and daily average water temperature at Modesto (MOD; RM 17) ranged between 50.2˚F and 57.6˚F (Figure 8). Instantaneous turbidity ranged between 0.56 NTU and 3.87 NTU (Figure 9), and instantaneous dissolved oxygen ranged between 10.11 mg/L and 12.82 mg/L (Figure 10).
Table 2. Annual Fall-run Chinook passage prior to December 16, 2009 - 2012.Figure 6. Fall-Run Chinook salmon cumulative passage recorded at the Tuolumne River Weir in 2009 - 2012.Figure 7. Daily upstream Chinook passage at the Tuolumne River Weir in relation to daily average flows (cfs) recorded in the Tuolumne River at La Grange (LGN) and Modesto (MOD), and in the San Joaquin River at Vernalis (VNS) in 2012.Figure 8. Daily upstream Chinook passage at the Tuolumne River Weir in relation to instantaneous water temperature recorded at the weir, and daily average water temperature recorded in the Tuolumne River at Modesto (MOD) and in the San Joaquin River at Vernalis (VER), Mossdale (MSD) and Rough & Ready (RRI) in 2012.
Figure 9. Daily upstream Chinook passage at the Tuolumne River Weir in relation to instantaneous turbidity recorded at the weir in 2012. Figure 10. Daily upstream Chinook passage at the Tuolumne River Weir in relation to instantaneous dissolved oxygen recorded at the weir, and daily average dissolved oxygen recorded in the San Joaquin River at Mossdale (MSD) and Rough & Ready (RRI) in 2012.
|
Mokelumne River Woodbridge Dam Fish Ladder Monitoring Fall-run Chinook salmon returning to the Mokelumne are counted annually by East Bay Municipal Utility District (EBMUD) as they ascend the fish ladder at Woodbridge Dam. A total of 169 Chinook salmon have been observed passing upstream of the dam between December 3 and December 16, increasing the total for the season to 12,075. Daily passage ranged between 0 and 52 Chinook (Figure 11). Daily average flow in the Mokelumne River fluctuated between 224 and 672 cfs at Camanche Reservoir (CMN) and between 146 cfs and 538 cfs at Woodbridge Dam (WBR). 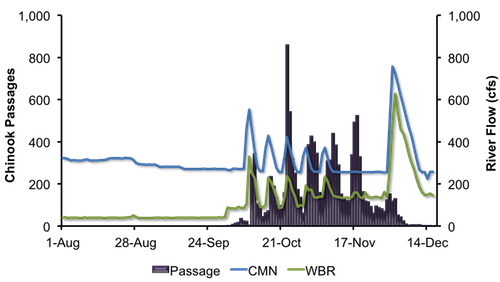
Figure 11. Daily upstream Chinook passage recorded at the Woodbridge Dam fish ladder in relation to daily average flows (cfs) recorded in the Mokelumne River at Camanche Reservoir (CMN), 2012.
|
San Joaquin Basin Escapement Surveys Annual carcass surveys conducted by CDFG continued through the week of December 10. The number of live fish and redds observed on all rivers has been decreasing during recent weeks since peak spawning in mid-November. Live counts during the week of December 10th were 94 on the Stanislaus River, 42 on the Tuolumne River and 41 on the Merced River.
A total of 299 females have been spawned at the Merced River Fish Facility (MRFF) as of December 16, compared to a total of only 73 in 2011.
|
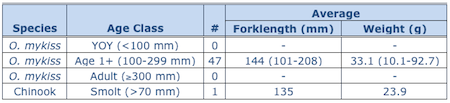
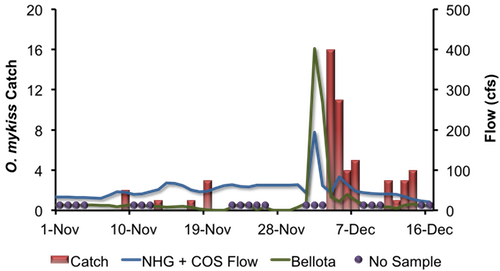
2012 Calaveras River Juvenile Migration Monitoring The Calaveras River rotary screw trap at Shelton Road (RM 28) operated eight days between December 3 and December 16 and a total of 47 O. mykiss were captured,  increasing the total to 54. Daily catches ranged from one to 16 individuals (Figure 1), and all O. mykiss captured were Age 1+ (100-299 mm) and were rated as parr (n=6), silvery parr (n=35) and smolt (n=4). Average forklengths and weights of O. mykiss are provided in Table 3. increasing the total to 54. Daily catches ranged from one to 16 individuals (Figure 1), and all O. mykiss captured were Age 1+ (100-299 mm) and were rated as parr (n=6), silvery parr (n=35) and smolt (n=4). Average forklengths and weights of O. mykiss are provided in Table 3. One yearling Chinook salmon was captured during this reporting period, increasing the season total to two yearlings. Instantaneous temperature recorded at the trap ranged from 46.9ºF to 57.2ºF, and turbidity ranged from 2.15 NTU to 30.80 NTU. During the reporting period, daily average combined flow from New Hogan Dam (NHG) and Cosgrove Creek (COS) fluctuated between 21 cfs and 84 cfs, and at Bellota (MRS) flow fluctuated between 5 cfs and 269 cfs (Figure 12). Table 3. Biosampling data for O. mykiss captured at Shelton Road between December 3 and December 16, 2012. Parenthesis indicates range.
Figure 12. Daily O. mykiss catch at Shelton Road, and Calaveras River flow recorded by New Hogan Dam (NHG) and Cosgrove Creek (COS) combined and flow recorded at Bellota (MRS), in 2012.
|
San Joaquin River Conditions
During the reporting period, flow in the San Joaquin River at Vernalis fluctuated from 1,400 cfs to 1,809 cfs (Figure 13). Water temperature in the San Joaquin River ranged from 48.9°F to 57.2°F at Vernalis, from 49.3°F to 57.5°F at Mossdale, and from 53.8°F to 57.6°F at Rough 'n Ready Island (Figure 14). Average daily dissolved oxygen (DO) in the San Joaquin River fluctuated from 6.1 mg/L to 8.3 mg/L in the deep-water ship channel (measured at Rough 'n Ready Island), and from 8.8 mg/L to 10.5 mg/L at Mossdale (Figure 15).
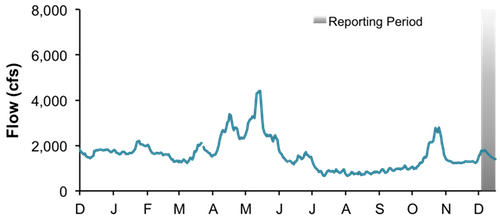
Figure 13. San Joaquin River flow at Vernalis from December 1, 2011, through December 16, 2012.
Figure 14. San Joaquin River daily average water temperature at Vernalis, Mossdale, and Rough 'n Ready from December 1, 2011, through December 16, 2012.
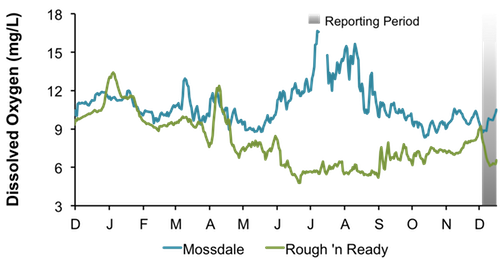
Figure 15. San Joaquin River daily average dissolved oxygen at Mossdale and Rough 'n Ready, from December 1, 2011, through December 16, 2012.
|
Delta Exports
Mean daily pumping at the C.W. Jones Pumping Plant (federal pumps previously known as Tracy Pumping Plant) ranged from 2,758 cfs to 4,421 cfs (Figure 16). Mean daily pumping at the Harvey O. Banks Pumping Plant (state pumps) ranged from 2,662 cfs to 7,123 cfs. Combined total exports (state and federal pumps) during this period ranged from 5,920 cfs to 11,484 cfs.
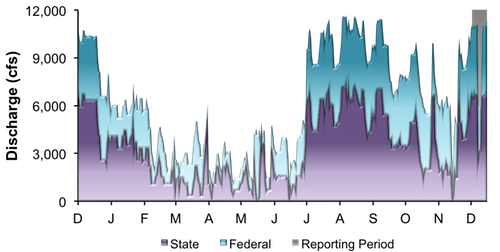
Figure 16. Daily exports at the state and federal pumping stations from December 1, 2011, through December 16, 2012.
|
|
|
|
|
|
|