| Volume 2012, Issue 3 | November 6, 2012 |
|

VAKI Riverwatcher Seminar:
November 6 & 8
Honolulu Bar Revegetation:
November 17
|
|
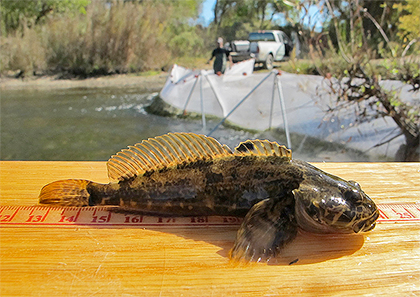
Photo by FISHBIO |
Key Highlights
October 15 - October 28, 2012
Stanislaus River Weir Monitoring continued with a total of 2,552 Chinook salmon passing upstream through the weir between October 15 and October 28, increasing the total to 3,534.
Tuolumne River Weir Monitoring continued with a total of 771 Chinook salmon passing upstream through the weir between October 15 and October 28, increasing the total to 1,293.
Mokelumne River Woodbridge Dam Fish Ladder Monitoring continued with a total of 3,313 Chinook salmon passed upstream of the dam between October 15 and October 28, increasing the total to 4,275.
San Joaquin Basin Escapement Surveys. Annual carcass surveys conducted by California Department of Fish and Game (CDFG) continued through the week of October 22.
San Joaquin River Conditions. San Joaquin River flow at Vernalis ranged from 1,830 cfs to 2,788 cfs. Daily average water temperature in the San Joaquin River ranged from 58.1°F to 63.7°F at Vernalis, and from 58.7°F to 65.3°F at Mossdale. Daily average dissolved oxygen (DO) in the San Joaquin River ranged from 8.5 mg/L to 9.6 mg/L at Mossdale, and from 7.0 mg/L to 7.6 mg/L in the deep-water ship channel (measured at Rough 'n Ready Island).
Delta Exports. Combined total exports (state and federal pumps) fluctuated during the reporting period, ranging from 5,444 cfs to 9,948 cfs.
|
|
2012 Stanislaus River Weir Adult Migration Monitoring
Between October 15 and October 28 a total of 2,552 Chinook salmon were detected by the Vaki Riverwatcher as they passed upstream of the Stanislaus River weir. The  total passage to-date of 3,534 is the highest observed at the Stanislaus weir since monitoring began in 2003 (Figure 1; Table 1). Daily passage ranged between 32 and 383 Chinook salmon (Figure 2). total passage to-date of 3,534 is the highest observed at the Stanislaus weir since monitoring began in 2003 (Figure 1; Table 1). Daily passage ranged between 32 and 383 Chinook salmon (Figure 2).
Instantaneous water temperature measured at the weir ranged between 52.3˚F and 60.3˚F, and daily average water temperature at Ripon (RPN; RM 15) ranged between 57.2˚F and 60.3˚F (Figure 3). Instantaneous turbidity ranged between 1.30 NTU and 5.30 NTU (Figure 4). Instantaneous dissolved oxygen at the weir ranged between 9.33 mg/L and 12.11 mg/L, and daily average dissolved oxygen at Ripon (RPN; RM 15) ranged from 8.77 mg/L to 9.39 mg/L (Figure 5).
Daily average flows in the Stanislaus River at Goodwin Dam (GDW; RM 58) ranged from 514 cfs to 1,504 cfs. Flows at Ripon (RIP; RM 15) ranged from 656 cfs to 1,280 cfs. Note: flows downstream of Goodwin Dam may differ from dam releases due to irrigation, precipitation and other factors.
Table 1. Annual fall-run Chinook passage at the Stanislaus River weir prior to October 28, 2003-2012.Figure 1. Cumulative passage of fall-run Chinook salmon recorded at the Stanislaus River weir from 2003-2012.Figure 2. Daily upstream Chinook passage at the Stanislaus River weir in relation to daily average flows (cfs) recorded in the Stanislaus River at Goodwin (GDW) and Ripon (RIP), 2012.Figure 3. Daily upstream Chinook passage recorded at the Stanislaus River weir in relation to instantaneous water temperature recorded at the weir, and daily average water temperature recorded in the Stanislaus River at Ripon (RPN), and in the San Joaquin River at Vernalis (VER), Mossdale (MSD) and Rough & Ready (RRI) in 2012.
Figure 4. Daily upstream Chinook passage at the Stanislaus River weir in relation to instantaneous turbidity recorded at the weir in 2012.Figure 5. Daily upstream Chinook passage at the Stanislaus River weir in relation to instantaneous dissolved oxygen recorded at the weir, and daily average dissolved oxygen recorded in the Stanislaus River at Ripon (RPN), and in the San Joaquin River at Mossdale (MSD) and Rough & Ready (RRI) in 2012.
|
2012 Tuolumne River Weir Adult Migration Monitoring
Between October 15 and October 28 a total of 771 Chinook salmon were detected by the Vaki Riverwatcher as they passed upstream of the Tuolumne River weir. The total  passage to-date of 1,293 is the highest observed at the Tuolumne weir since monitoring began in 2009 (Figure 6; Table 2). Daily passage ranged between 10 and 138 Chinook salmon (Figure 7). passage to-date of 1,293 is the highest observed at the Tuolumne weir since monitoring began in 2009 (Figure 6; Table 2). Daily passage ranged between 10 and 138 Chinook salmon (Figure 7).
Daily average flow in the Tuolumne River ranged from 167 cfs to 588 cfs at La Grange (LGN; RM 50) and 215 cfs and 640 cfs at Modesto (MOD; RM 17). Note: flows downstream of La Grange may be higher than dam releases due to accretion and Dry Creek inflow.
Instantaneous water temperature measured at the weir ranged between 54.5˚F and 66.7˚F and daily average water temperature at Modesto (MOD; RM 17) ranged between 56.8˚F and 67.6˚F (Figure 8). Instantaneous turbidity ranged between 1.39 NTU and 4.00 NTU (Figure 9), and instantaneous dissolved oxygen ranged between 8.14 mg/L and 11.64 mg/L (Figure 10).
Table 2. Annual Fall-run Chinook passage prior to October 28, 2009 - 2012.Figure 6. Fall-Run Chinook salmon cumulative passage recorded at the Tuolumne River Weir in 2009 - 2012.Figure 7. Daily upstream Chinook passage at the Tuolumne River Weir in relation to daily average flows (cfs) recorded in the Tuolumne River at La Grange (LGN) and Modesto (MOD), and in the San Joaquin River at Vernalis (VNS) in 2012.Figure 8. Daily upstream Chinook passage at the Tuolumne River Weir in relation to instantaneous water temperature recorded at the weir, and daily average water temperature recorded in the Tuolumne River at Modesto (MOD) and in the San Joaquin River at Vernalis (VER), Mossdale (MSD) and Rough & Ready (RRI) in 2012.
Figure 9. Daily upstream Chinook passage at the Tuolumne River Weir in relation to instantaneous turbidity recorded at the weir in 2012. Figure 10. Daily upstream Chinook passage at the Tuolumne River Weir in relation to instantaneous dissolved oxygen recorded at the weir, and daily average dissolved oxygen recorded in the San Joaquin River at Mossdale (MSD) and Rough & Ready (RRI) in 2012.
|
Mokelumne River Woodbridge Dam Fish Ladder Monitoring Fall-run Chinook salmon returning to the Mokelumne are counted annually by East Bay Municipal Utility District (EBMUD) as they ascend the fish ladder at Woodbridge Dam. A total of 3,313 Chinook salmon have been observed passing upstream of the dam between October 15 and October 28, increasing the total for the season to 4,275. Daily passage ranged between 64 and 860 Chinook (Figure 11). Daily average flow in the Mokelumne River fluctuated between 255 and 428 cfs at Camanche Reservoir (CMN) and between 86 cfs and 237 cfs at Woodbridge Dam (WBR). 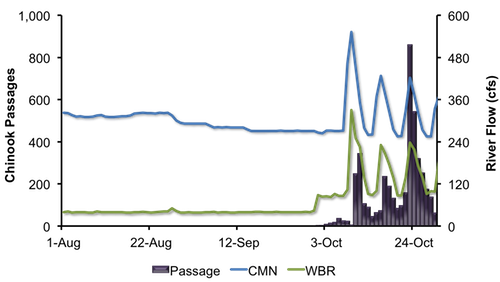
Figure 11. Daily upstream Chinook passage recorded at the Woodbridge Dam fish ladder in relation to daily average flows (cfs) recorded in the Mokelumne River at Camanche Reservoir (CMN), 2012.
|
San Joaquin Basin Escapement Surveys Annual carcass surveys conducted by CDFG continued through the week of October 22. The largest number of live fish was observed on the Stanislaus River, with a peak live count thus far of 112 Chinook salmon. Peak live counts on the Merced and Tuolumne rivers were 9 and 20, respectively.
No redds were observed on the Merced River, one on the Tuolumne River, and twenty-five were recorded on the Stanislaus River. A peak in the number of redds observed for the fall-run season typically occurs in mid- to late-November.
One female has been spawned at the Merced River Fish Facility (MRFF) as of October 28.
|
San Joaquin River Conditions
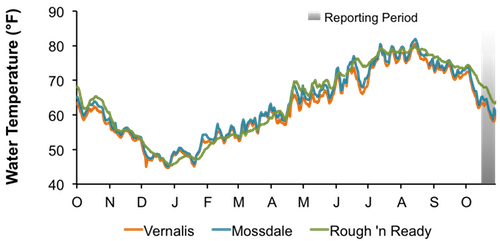
During the reporting period, flow in the San Joaquin River at Vernalis fluctuated from 1,830 cfs to 2,788 cfs (Figure 12). Water temperature in the San Joaquin River ranged from 58.1°F to 63.7°F at Vernalis, from 58.7°F to 65.3°F at Mossdale, and from 63.4°F to 68.6°F at Rough 'n Ready Island (Figure 13). Average daily dissolved oxygen (DO) in the San Joaquin River fluctuated from 8.5 mg/L to 9.6 mg/L in the deep-water ship channel (measured at Rough 'n Ready Island), and from 7.0 mg/L to 7.6 mg/L at Mossdale (Figure 14).
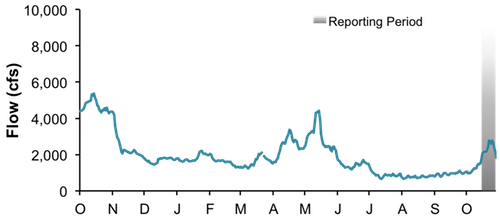
Figure 12. San Joaquin River flow at Vernalis from October 1, 2011, through October 28, 2012.
Figure 13. San Joaquin River daily average water temperature at Vernalis, Mossdale, and Rough 'n Ready from October 1, 2011, through October 28, 2012.
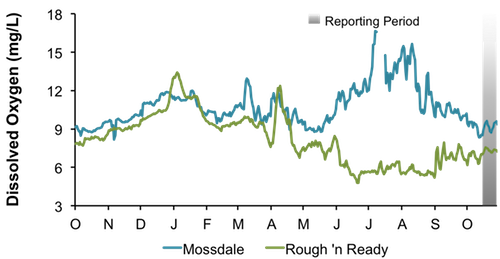
Figure 14. San Joaquin River daily average dissolved oxygen at Mossdale and Rough 'n Ready, from October 1, 2011, through October 28, 2012.
|
Delta Exports
Mean daily pumping at the C.W. Jones Pumping Plant (federal pumps previously known as Tracy Pumping Plant) ranged from 1,419 cfs to 4,426 cfs (Figure 15). Mean daily pumping at the Harvey O. Banks Pumping Plant (state pumps) ranged from 1,478 cfs to 6,652 cfs. Combined total exports (state and federal pumps) during this period ranged from 5,444 cfs to 9,948 cfs.
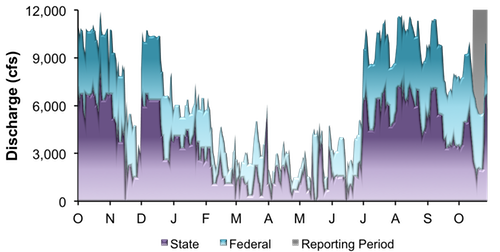
Figure 15. Daily exports at the state and federal pumping stations from October 1, 2011, through October 28, 2012.
|
|
|
|
|
|
|