| Volume 2012, Issue 2 | October 25, 2012 |
|

Stanislaus River Salmon Festival:
November 3
VAKI Riverwatcher Seminar:
November 6 & 8
|
|

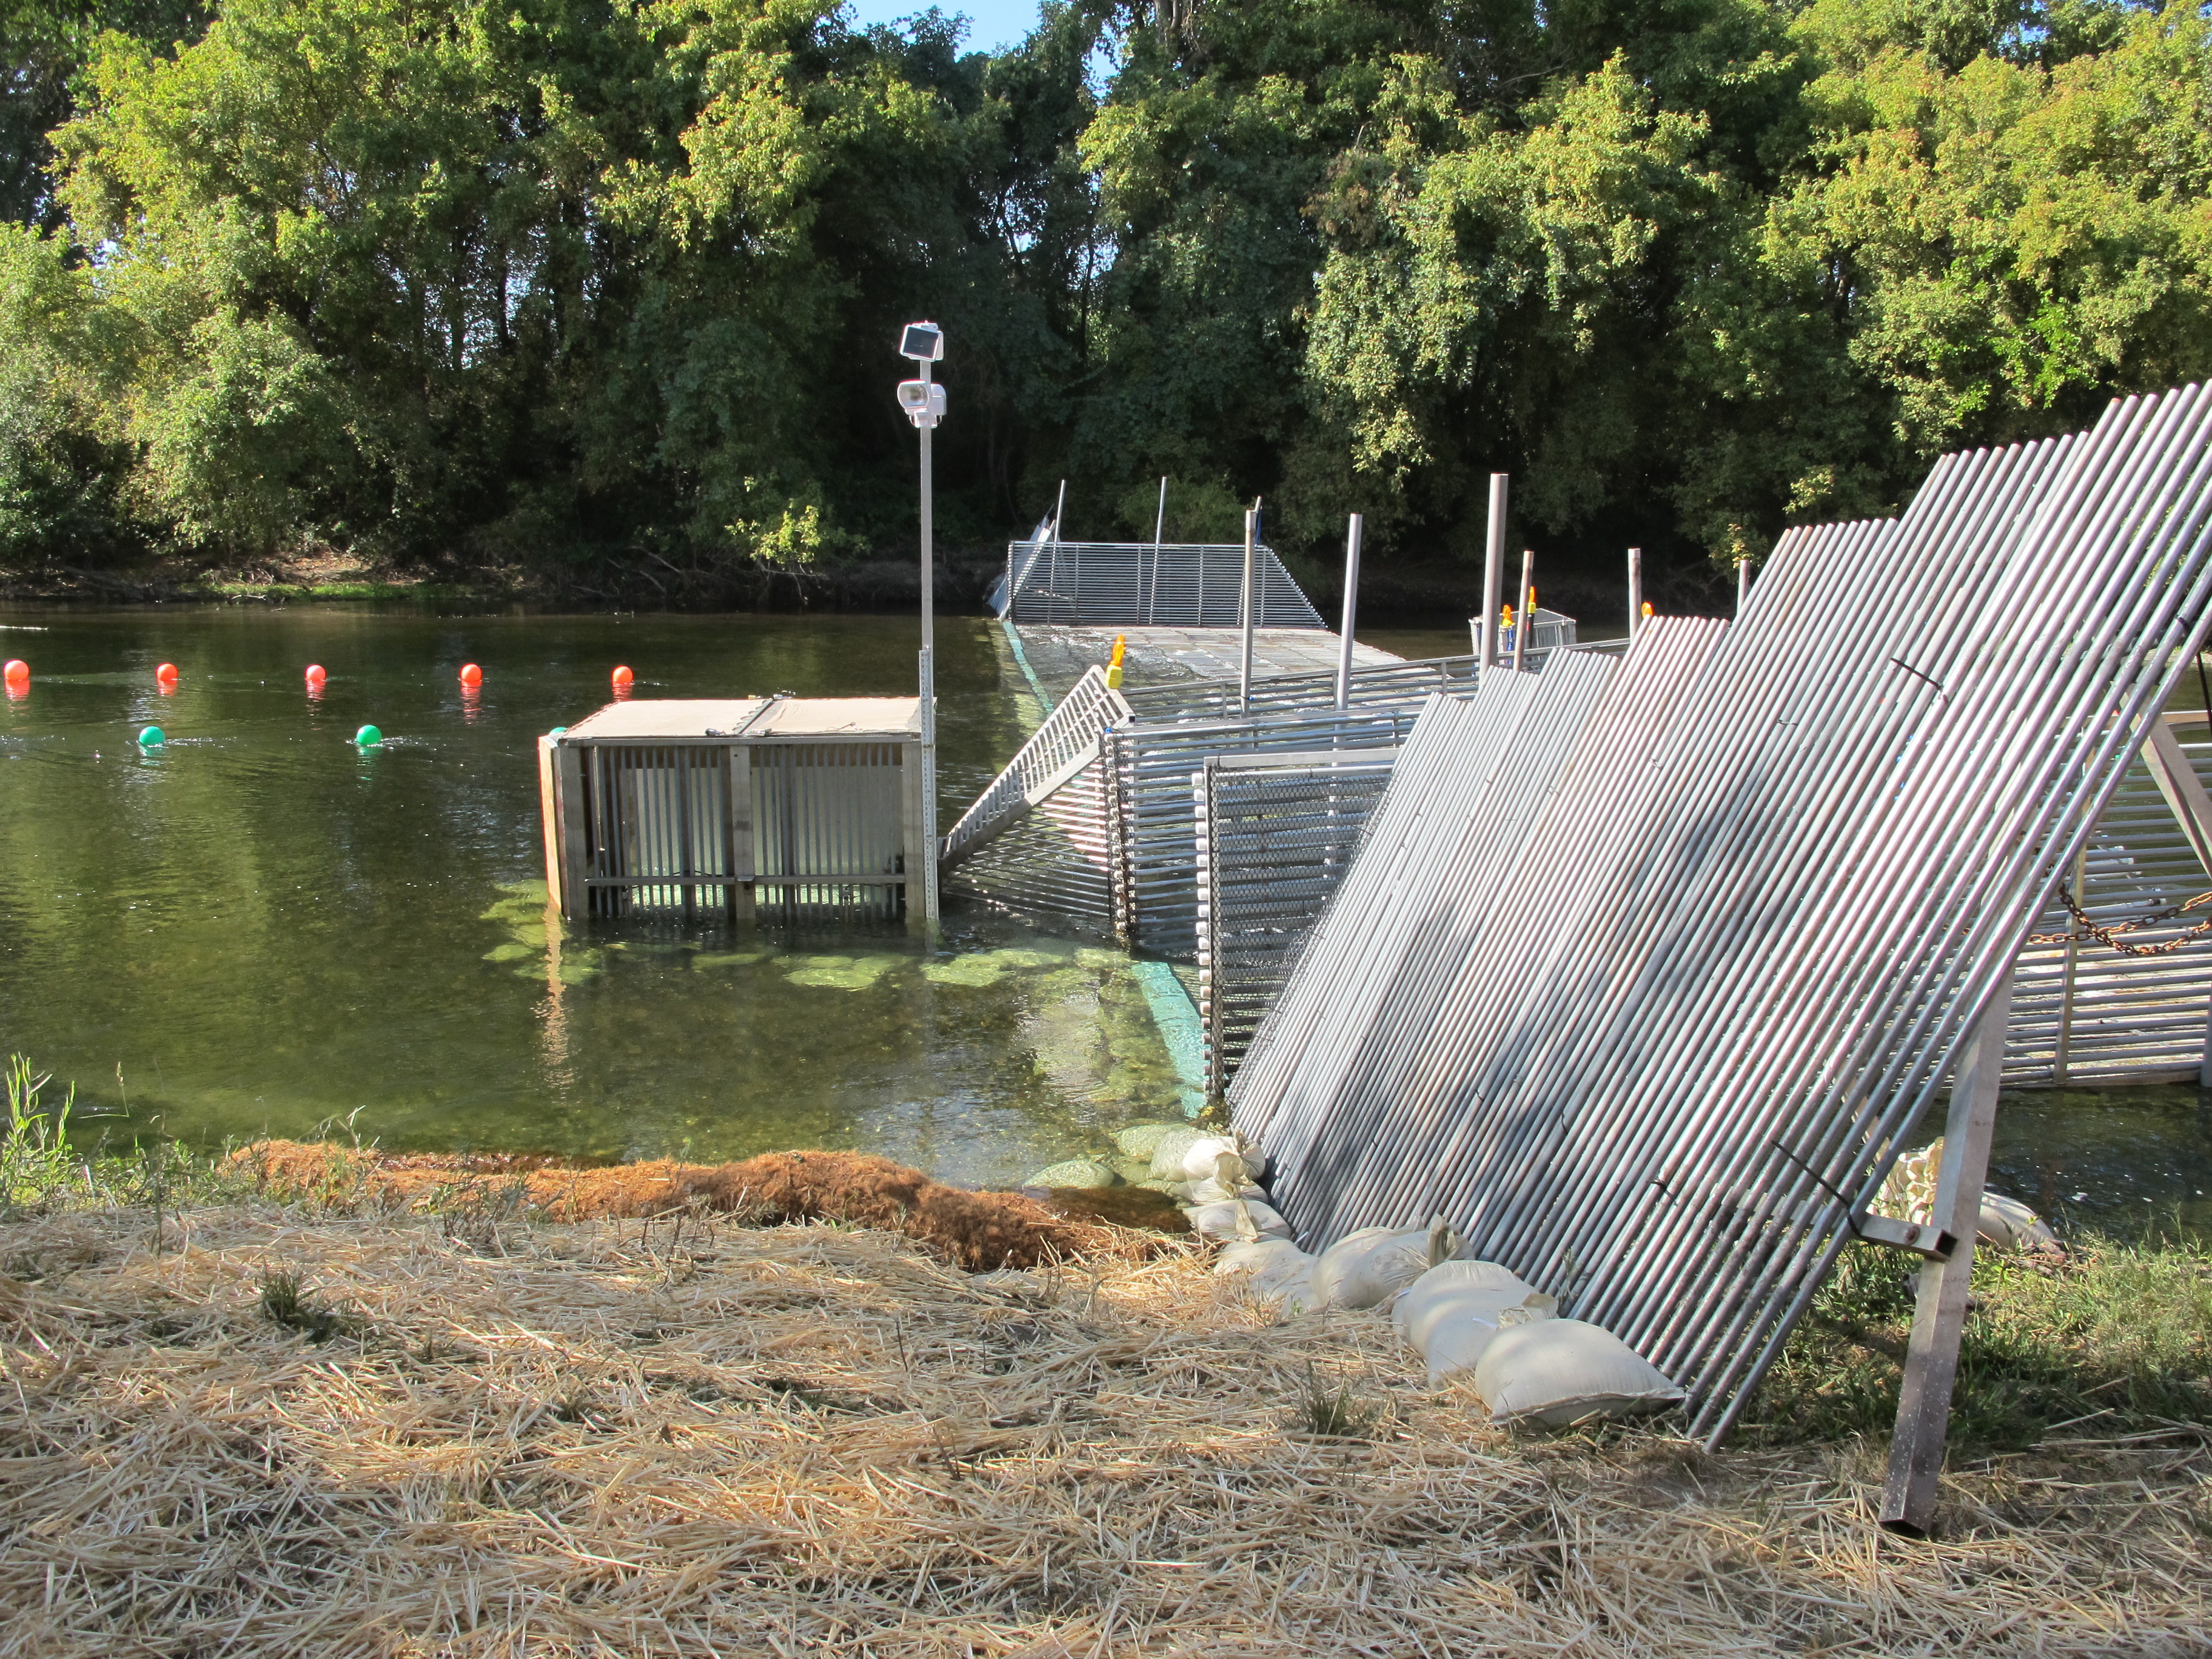
Photo by FISHBIO |
Key Highlights
October 1 - October 14, 2012
Stanislaus River Weir Monitoring continued with a total of 748 Chinook salmon passed upstream through the weir between October 1 and October 14, increasing the season total to 980.
Tuolumne River Weir Monitoring continued with a total of 493 Chinook salmon passed upstream through the weir between October 1 and October 14, increasing the season total to 551.
Mokelumne River Woodbridge Dam Fish Ladder Monitoring continued during the reporting period and a total of 961 Chinook passed upstream of the dam between October 1 and October 14.
San Joaquin Basin Escapement Surveys. Annual carcass surveys conducted by California Department of Fish and Game (CDFG) continued through the week of October 8.
San Joaquin River Conditions. San Joaquin River flow at Vernalis ranged from 960 cfs to 1,559 cfs. Daily average water temperature in the San Joaquin River ranged from 62.0°F to 72.5°F at Vernalis, and from 62.9°F to 73.8°F at Mossdale. Daily average dissolved oxygen (DO) in the San Joaquin River ranged from 8.3 mg/L to 9.6 mg/L at Mossdale, and from 6.2 mg/L to 7.2 mg/L in the deep-water ship channel (measured at Rough 'n Ready Island).
Delta Exports. Combined total exports (state and federal pumps) fluctuated during the reporting period, ranging from 6,591 cfs to 11,666 cfs.
|
|
2012 Stanislaus River Weir Adult Migration Monitoring
Between October 1 and October 14 a total of 748 Chinook salmon were detected by the Vaki Riverwatcher as they passed upstream of the Stanislaus River weir. The year-to-date total passage of 980 is the highest observed since 2003 (Figure 1; Table 1). Daily passage during the reporting period ranged between 8 and 143 Chinook salmon (Figure 2).
 Instantaneous water temperature measured at the weir ranged between 55.9˚F and 63.9˚F, and daily average water temperature at Ripon (RPN; RM 15) ranged between 59.2˚F and 68.4˚F (Figure 3). Instantaneous turbidity ranged between 1.23 NTU and 4.52 NTU (Figure 4). Instantaneous dissolved oxygen at the weir ranged between 9.77 mg/L and 11.28 mg/L, and daily average dissolved oxygen at Ripon (RPN; RM 15) ranged from 8.23 mg/L to 9.87 mg/L (Figure 5). Instantaneous water temperature measured at the weir ranged between 55.9˚F and 63.9˚F, and daily average water temperature at Ripon (RPN; RM 15) ranged between 59.2˚F and 68.4˚F (Figure 3). Instantaneous turbidity ranged between 1.23 NTU and 4.52 NTU (Figure 4). Instantaneous dissolved oxygen at the weir ranged between 9.77 mg/L and 11.28 mg/L, and daily average dissolved oxygen at Ripon (RPN; RM 15) ranged from 8.23 mg/L to 9.87 mg/L (Figure 5).
Daily average flows in the Stanislaus River at Goodwin Dam (GDW; RM 58) ranged from 255 cfs to 1,466 cfs. Flows at Ripon (RIP; RM 15) ranged from 323 cfs to 790 cfs. Note: flows downstream of Goodwin Dam may differ from dam releases due to irrigation, precipitation and other factors.Table 1. Annual fall-run Chinook passage at the Stanislaus River weir prior to September 30, 2003-2012.Figure 1. Cumulative passage of fall-run Chinook salmon recorded at the Stanislaus River weir from 2003-2012.Figure 2. Daily upstream Chinook passage at the Stanislaus River weir in relation to daily average flows (cfs) recorded in the Stanislaus River at Goodwin (GDW) and Ripon (RIP), 2012.Figure 3. Daily upstream Chinook passage recorded at the Stanislaus River weir in relation to instantaneous water temperature recorded at the weir, and daily average water temperature recorded in the Stanislaus River at Ripon (RPN), and in the San Joaquin River at Vernalis (VER), Mossdale (MSD) and Rough & Ready (RRI) in 2012.
Figure 4. Daily upstream Chinook passage at the Stanislaus River weir in relation to instantaneous turbidity recorded at the weir in 2012.Figure 5. Daily upstream Chinook passage at the Stanislaus River weir in relation to instantaneous dissolved oxygen recorded at the weir, and daily average dissolved oxygen recorded in the Stanislaus River at Ripon (RPN), and in the San Joaquin River at Mossdale (MSD) and Rough & Ready (RRI) in 2012.
|
2011 Tuolumne River Weir Adult Migration Monitoring
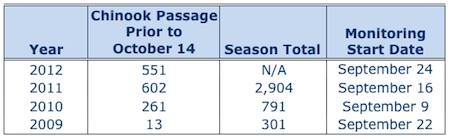
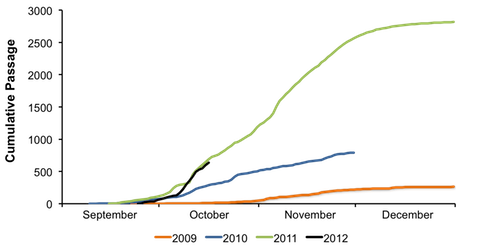
Between October 1 and October 14 a total of 493 Chinook salmon were detected by the Vaki Riverwatcher as they passed upstream of the Tuolumne River weir. The total of 551 cumulative passage this year to date is closely tracking 2011 (Figure 6; Table 2). Daily passage ranged between 6 and 75 Chinook salmon (Figure 7).  Daily average flow in the Tuolumne River ranged from 164 cfs to 169 cfs at La Grange (LGN; RM 50) and 188 cfs and 262 cfs at Modesto (MOD; RM 17). Note: flows downstream of La Grange may be higher than dam releases due to accretion and Dry Creek inflow. Daily average flow in the Tuolumne River ranged from 164 cfs to 169 cfs at La Grange (LGN; RM 50) and 188 cfs and 262 cfs at Modesto (MOD; RM 17). Note: flows downstream of La Grange may be higher than dam releases due to accretion and Dry Creek inflow. Instantaneous water temperature measured at the weir ranged between 62.6˚F and 76.0˚F and daily average water temperature at Modesto (MOD; RM 17) ranged between 64.4˚F and 73.6˚F (Figure 8). Instantaneous turbidity ranged between 0.59 NTU and 6.31 NTU (Figure 9), and instantaneous dissolved oxygen ranged between 8.28 mg/L and 10.10 mg/L (Figure 10). Table 2. Annual Fall-run Chinook passage prior to October 14, 2009 - 2012.
Figure 6. Fall-Run Chinook salmon cumulative passage recorded at the Tuolumne River weir in 2009 - 2012.
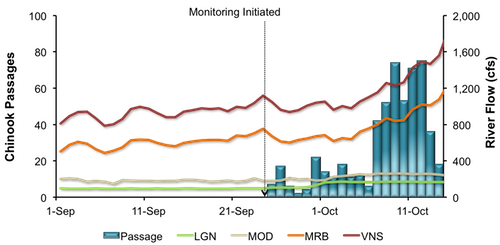
Figure 7. Daily upstream Chinook passage at the Tuolumne River Weir in relation to daily average flows (cfs) recorded in the Tuolumne River at La Grange (LGN) and Modesto (MOD), and in the San Joaquin River at Vernalis (VNS) in 2012.

Figure 8. Daily upstream Chinook passage at the Tuolumne River Weir in relation to instantaneous water temperature recorded at the weir, and daily average water temperature recorded in the Tuolumne River at Modesto (MOD) and in the San Joaquin River at Vernalis (VER), Mossdale (MSD) and Rough & Ready (RRI) in 2012.
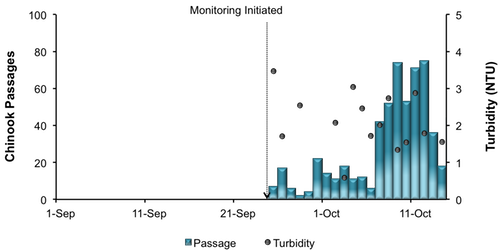
Figure 9. Daily upstream Chinook passage at the Tuolumne River Weir in relation to instantaneous turbidity recorded at the weir in 2012.
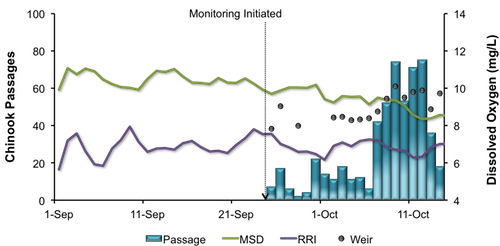
Figure 10. Daily upstream Chinook passage at the Tuolumne River Weir in relation to instantaneous dissolved oxygen recorded at the weir, and daily average dissolved oxygen recorded in the San Joaquin River at Mossdale (MSD) and Rough & Ready (RRI) in 2012.
|
Mokelumne River Woodbridge Dam Fish Ladder Monitoring Fall-run Chinook salmon returning to the Mokelumne are counted annually by East Bay Municipal Utility District (EBMUD) as they ascend the fish ladder at Woodbridge Dam. A total of 961 Chinook salmon have been observed passing upstream of the dam so far this season. Daily passage ranged between 1 and 343 Chinook (Figure 11). Daily average flow in the Mokelumne River fluctuated between 260 and 553 cfs at Camanche Reservoir (CMN) and between 83 cfs and 330 cfs at Woodbridge Dam (WBR).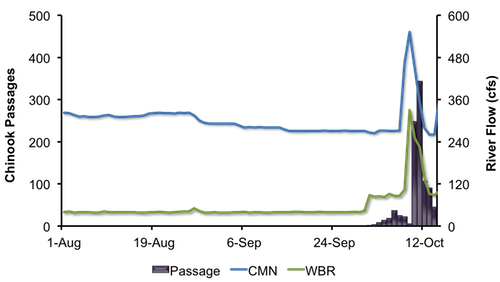
Figure 11. Daily upstream Chinook passage recorded at the Woodbridge Dam fish ladder in relation to daily average flows (cfs) recorded in the Mokelumne River at Camanche Reservoir (CMN), 2012.
|
San Joaquin Basin Escapement Surveys Annual carcass surveys conducted by CDFG continued through the week of October 8. The largest number of live fish was observed on the Stanislaus River, with a peak live count thus far of 12 Chinook. Peak live counts on the Merced and Tuolumne rivers were 0 and 5, respectively. Only one redd was observed on each of the rivers during the week of October 8. No females have been spawned at the Merced River Fish Facility (MRFF) as of October 14.
|
San Joaquin River Conditions
During the reporting period, flow in the San Joaquin River at Vernalis fluctuated from 960 cfs to 1,559 cfs (Figure 12). Water temperature in the San Joaquin River ranged from 62.0°F to 72.5°F at Vernalis, from 62.9°F to 73.8°F at Mossdale, and from 68.9°F to 74.4°F at Rough 'n Ready Island (Figure 13). Average daily dissolved oxygen (DO) in the San Joaquin River fluctuated from 6.2 mg/L to 7.2 mg/L in the deep-water ship channel (measured at Rough 'n Ready Island), and from 8.3 mg/L to 9.6 mg/L at Mossdale (Figure 14).
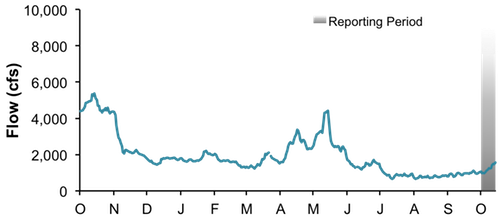
Figure 12. San Joaquin River flow at Vernalis from October 1, 2011, through October 14, 2012.
Figure 13. San Joaquin River daily average water temperature at Vernalis, Mossdale, and Rough 'n Ready from October 1, 2011, through October 14, 2012.
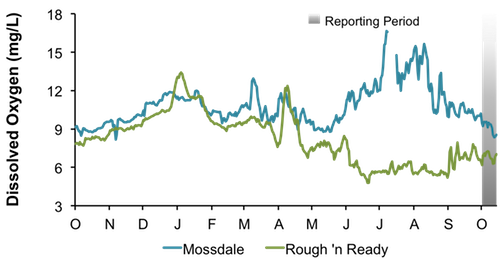
Figure 14. San Joaquin River daily average dissolved oxygen at Mossdale and Rough 'n Ready, from October 1, 2011, through October 14, 2012.
|
Delta Exports
Mean daily pumping at the C.W. Jones Pumping Plant (federal pumps previously known as Tracy Pumping Plant) ranged from 4,260 cfs to 4,412 cfs (Figure 15). Mean daily pumping at the Harvey O. Banks Pumping Plant (state pumps) ranged from 3,345 cfs to 5,598 cfs. Combined total exports (state and federal pumps) during this period ranged from 7,631 cfs to 10,010 cfs.
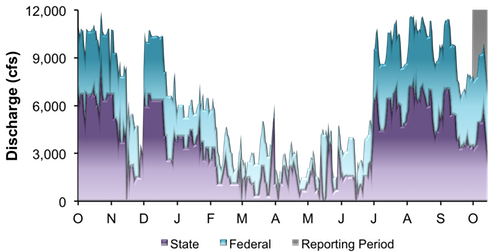
Figure 15. Daily exports at the state and federal pumping stations from October 1, 2011, through October 14, 2012.
|
|
|
|
|
|
|
Come and see what's going on at FISHBIO.com and follow us on   
Also, sign up and get the latest news and information with our email newsletter.
Data Disclaimer: The data displayed on the FISHBIO website are courtesy of California Department of Fish & Game (CDFG), U.S. Fish & Wildlife Service (USFWS), Tri-dam, Turlock Irrigation District (TID), Modesto Irrigation District (MID), East Bay Municipal Utility District (EBMUD) and FISHBIO. Data are intended to be current, but are preliminary and are not guaranteed to be accurate. Source data compiled and provided by FISHBIO, from whom further information can be obtained. Use or reproduction of this data is prohibited without prior permission.
|
|