 |
|
|
|
|
|
|
|
|
|
|
|
|
|
|
|
|
In this issue, we present some of our favorite In the News topics and direct you to some great webinar presentations that have been recently delivered by our team.
This issue, we will highlight some subject matter expertise we've contributed to the community in the Ask the Expert section. In addition, we will share some things we have learned in recent meetings or projects in a section entitled Heard Around the Water Cooler as well as inform you of Upcoming Events.
We welcome your feedback for future issues.
The Management Team
StatSlice Systems
|
|
Recent Presentations Delivered by Our Team
|
|
Big SQL Analytics: Amazon Redshift with Tableau
On September 24, James Vogel, Senior Consultant at StatSlice Systems, presented a webinar on the Amazon Redshift connector for Tableau as part of our series on Big SQL Analytics. In this webinar, he walks you through connecting Tableau to Redshift and pulling in a large data set to showcase the power of combining these two products. Click here to watch latest video.
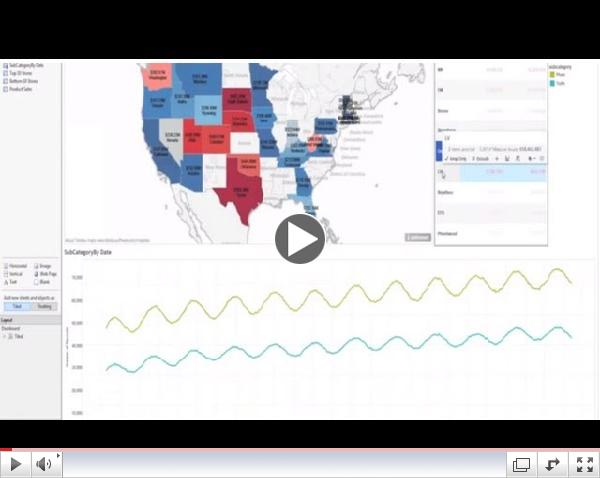 | | Big SQL Analytics: Amazon Redshift with Tableau |

Research Report: BI Universities, Release 2.1
On October 10, StatSlice Systems released an update to our popular research report on universities in the US & Canada offering degrees and certificates in business intelligence and analytics related areas. The report has garnered a large amount of feedback thus far. Click here to view the report.

Visualizing University BI & Analytics Programs
On October 14, Jared Decker, Co-Founder of StatSlice Systems, published a blog with a visual breakdown of our university report. The handy tableau chart features interesting scatter plots to help the viewer grasp the scope of our university report. The information can be dynamically rearranged based on many factors. To read the full blog, click here.
|
|

We're Hiring! Are You Looking for a New Job or Internship?
We are seeking a BI Consultant with 1-3 years experience and working knowledge of Microsoft SQL Server to join our team. Additionally, we have a Predictive Analytics Internship available to Masters or PhD students. The internship will give hands-on experience in working with clients to build data mining and predictive analytics systems. To learn more, click here.
Microsoft to Join the Big Data Conversation as an Elite Sponsor at Strata + Hadoop World, NYC
Microsoft to join the big Data conversation at the Strata+Hadoop conference in NYC this month. To read more, click here.
Tableau Software Partners with Google to Visualize Big Data at Gartner IT Symposium
Tableau is using google big query to visualize vast amounts of data collected at the last google I/O conference. Click here to read the full article.
|
Gathering requirements for any project, large or small, is the absolute most important task in the process. Any consultant will tell you that most projects fail here. It's not that they fail to gather requirements, but the requirements gathered are almost never adequate enough to satisfy the business need. More often than not, the tools will take the blame for the failure, but if proper requirements had been gathered at the beginning of the project, your team would have been able to select the correct tool for the job.
Now, having said that, the original question was "how" rather than "why", so let's discuss some of things we need to consider while gathering requirements. There are many strategies out there with great acronyms to help you remember them, but I can tell you right now, there is not one strategy that will work in all situations. Each project has a different audience, timeline, and budget that will all affect how you approach just thinking about the problem.
|
|
| Heard Around the Water Cooler |

Communicate Your BI Offerings with Other Departments
Standing around in the breakroom at my current client location, I over heard some people from a different department talking about Excel. Someone says, "I have to manually move data from the website over to Excel, then move the cells around, then do Excel lookups so that I can make a report for my boss. This takes way too much time." Well, of course it does! You are doing manual work that your IT department / BI group should have automated for you. It still amazes me today how companies still run on manually produced reports. I told the group that there are ways to automate those reports so they can get them instantaneously and still be able to use Excel or the internal company portal. They just need to talk to the right people.
Many companies don't include enough departments or groups in the conversation of automated reports, data analytics, and merging data components to reach their potential of efficiency and improved ROI. Don't make that mistake. Communicate your BI offerings to other groups and market.
Justin Taylor, Manager Consultant at StatSlice Systems
|
 StatSlice Partners and Consultants Will be Participating in These Upcoming Events StatSlice Partners and Consultants Will be Participating in These Upcoming Events
October 22, 11:00 am CDT, Big SQL Analytics - Cloudera Impala.
November 19, 11:00 am CDT, Data to Dashboard with Tableau 8.
|
 | | Jared Decker, Editor |
Who We Are and What We Do
As a full-service data services consulting firm headquartered in Dallas, TX, we partner with our clients to deliver business intelligence and business analytics solutions that help solve their most complex needs. With decades of industry experience and functional expertise, our consulting teams go beyond the norm to develop new insights, drive results, and help grow your business. Let us give you a hand. Email us today at info@statslice.com. Please also visit our website at: www.StatSlice.com, or give me a call at (214) 206-9290 ext. 110.
|
|
|
|
|
|
|
|
|
|
|
|
|
|
|
|
|
|
|
|
|
|
|
|


