Six years and counting
During the past six years, following the worst financial crisis since The Great Depression, the financial media has been talking about the deleveraging process happening worldwide. We've all heard the stories of how banks to consumers to corporations have deleveraged and continue to do so. It's as if all the global financial bailouts were all orchestrated just to buy us enough time so that we could get our financial houses in order. Then, miraculously, after someone blows the "all clear" alarm we can all go back to living our normal lives once again.
Back in 2009, I remember watching an Australian television interview with Paul Keating, the former Prime Minister and Treasurer of Australia. When asked if he thought this was a three-year crisis, a five-year crisis or something worse, he chose the latter. Mr. Keating went on to explain that our massive global debt had been accumulating for several decades now and that it would take many, many years to undue the damage.
How right he was! After six years supplying bridge loans to the global financial system, central banks worldwide have been playing a game of chicken. Can they actually print enough money to carry us over the abyss to the promised land? Or, will time become our bitter enemy?
As seen in the chart below, some progress has been made. The developed world's mega banks have reduced leverage throughout the system. If only we had a limitless amount of time available to continue on this road, all things would just work themselves out eventually. Or so it seems.
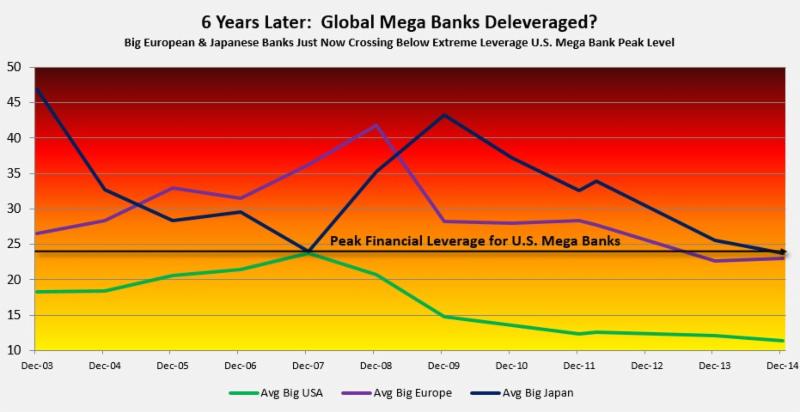 (Source: Morningstar - Average Financial Leverage - Optimus Leveraged Global Mega Bank Watchlist)
Fortunately, for those of us in the U.S., things look better on a relative scale. While our own mega banks were highly leveraged (24:1) pre-crisis, we've made great strides (thank you taxpayers!) in dropping that level back down to earth.
There is a different story, however, on the other side of the world. European mega banks' financial leverage peaked at 42:1, while Japanese banks peaked at 43:1. They weren't using punch bowls back then; they were filling up the swimming pools! Shockingly, six years removed, Europe and Japan have just now crossed down through our dangerously high levels of leverage from 2007.
Int'l Mega Bank Hit Parade: What's wrong with this picture?

(Source: Morningstar - Average Financial Leverage - Optimus Leveraged Global Mega Bank Watchlist)
Examples of the "swimming pool" sized punch bowls overseas are not hard to come by. In 2008, Deutsche Bank AG in Germany had leverage of 72:1! Six years later, they have brought it down to only 25:1.
European Bank Credit Agricole's current financial leverage is 32:1 and they are rated "F" by Morningstar for financial health, which is a rarity.
Japan's Mizuho Financial's leverage hit 66:1 in 2008-2009 and is now only 29:1.
There Will Be A Test
Our fragile financial system may be going through another real-life stress test soon. Who can say what the so-called "trigger" will be: China meltdown (stock market down nearly 30% in 3 weeks)? Greece crisis? Russian/Ukraine crisis?
At this juncture, allocating assets toward tactical equity & bond strategies that can move to safety makes sense, especially since we are so long overdue for a double-digit correction in the equity markets. Please let us know how we may help in this area.
For full details on each of our strategies, including fact sheets, please visit our website. Please call us directly:
(877) 885-7468 www.optimusadvisory.com info@optimusadvisory.com   | 