Tracking Brand Equity Using Social Media Tools |
|
|
We are often asked by our market research clients to manually code tracking study samples for any number of global markets, including English. Naturally, our curiosity was piqued when we began exploring social media tracking tools. This is not to suggest that traditional tracking studies don’t offer valuable trend and sentiment insights, or to suggest that we wish to automate ourselves out of business. Discussion on the pros and cons of using Social Media in market research is rife at today’s industry conferences. According to Core Strategies’ Marshall Toplansky, who discussed this topic at the recent MRA Conference in Washington D.C., it is about harnessing the technology to gain daily insights for a cost equivalent to years of tracking research. (Summary of this session can be found at Relevant Insights.) However, wouldn’t a brand or product manager, media analyst, investor, journalist, creative agency, PR, public affairs or political campaign manager (the list is endless), be keen on sitting down with morning coffee to a quick snapshot of his or her brand equity, without having to wait for the studies to be coded and results tabulated, to be sure, at no small expense. A huge factor to social media tracking is that it is unbiased, unelicited, unobtrusive, naturally occurring, timely and relevant—all of which provide the opportunity for new insights when mixed with traditional market research. This month Localspeak began using one of these Social Media analytics tools — the Netbase Insight Scorecard and Workbench. In doing so, we’ve observed the potential implications of a desktop tool that could track brand equity on a weekly, monthly, quarterly or annual basis against other category brands. While there are many lenses through which to measure brand equity, our exercise focused solely on brand passion intensity, a measure of strong minus weak emotions. We noticed a significant negative slide in passion intensity indices in the third week in June over the prior period for VOD and cable brands we had been tracking: Netflix, -9; Time Warner Cable, -17, Hulu, -14. This snapshot was even more startling against their positive passion intensity indices for the last quarter over the prior period (Netflix, +3; Time Warner, +9; Hulu, +6. To try and understand why passion intensity for these brands had cooled so precipitously during the third week in June, we looked at the conversation drivers. The most significant change for Netflix was seen in discussions on bandwidth, movie selection and cord-cutting, respectively; while customer service was the driving issue with Time Warner; and for Hulu cost and customer service drove the downslide in brand equity. As Social Media analytics tools begin gearing up to enable multilingual insights, and in anticipation of soon offering global brand equity insights, Localspeak is cutting its teeth on the latest listening and understanding tools. For companies who wish to experiment with these tools — perhaps to track a brand or two and triangulate the results with their ongoing brand trackers — this might be a good start. Please contact Localspeak if you would like to discuss our brand tracker offering. |
Case Study — Arabic Cosmetics Coding in Ascribe |
|
|
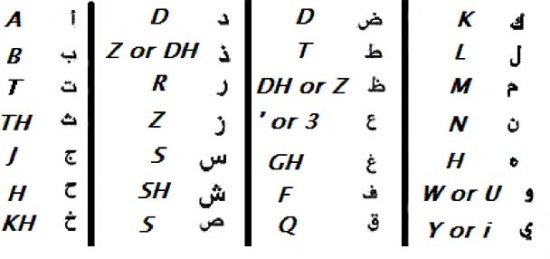
Our Arabic coder Nehmat Choueiri recently coded our first Arabic survey for a leading cosmetics company client. The study was executed to test brand recognition and the use and purchasing habits of Saudi customers. Having previously coded this identical study for numerous Asian and European markets, the Arabic survey was first to be coded in the Arabic language using the Ascribe platform. Although Nehmat had previously used the Ascribe tool to code French and English surveys during the past five years, she was concerned that in using the tool in this case, it might not support all the robust features she had grown accustomed to in other languages. Arabic is a Semitic language characterized by a wide number of linguistic varieties. It is spoken in more than 20 countries and in each country with its own dialect coding varies considerably from region to region. The Arabic alphabet sequence consists of 28 letters.
As the chart above shows, the letters “P” and “V” have no equivalent sound in Arabic, rather these two letters are transcribed as “B” and “F.” Therefore when transliterated in Arabic some brands such as Revlon and Makeup Forever” have various phonetic and writing forms. Revlon is altered to Riflon, Raflon, Rifleen, Riflan, etc, while Makeup Forever can be read as Makeub Foreber, Mikub Forebir, Micub Fouribar, and the like. However, the alteration of these phonetic forms did not affect the accuracy of the coding as Nehmat was familiar with the study-tested brands and cosmetics industry. Were she not, coding would have become a problematic issue. In addition, the Arabic language is written from right to left. This coding project required Nehmat to exercise caution when coding the first mention from a series of answers given by the respondent to a question that requires only one answer. What appears on one side is a codes list in the Latin alphabet; on the other side the verbatims are in Arabic. For example, when the respondent writes in Arabic, the first mention of such brands as Revlon, Max Factor, and Dior, will be at the extreme right of the phrase, Dior. While Nehmat encountered only one technical problem using Ascribe — the inability to use the “Expression tester” feature to test a word in the Arabic alphabet — it was not problematic in this particular coding project. However, for other types of coding it would have presented language coding issues.
|
Ashly Woo — Korean & French Media Specialist |
|

|
Ashley Woo joined Localspeak in 2006 as a media specialist in the Korean and French languages. Unable to be defined by one culture, this quintessential multi-lingual New Yorker was born in Seoul, Korea, and at age10 relocated with her family to Australia. |
|
Ashley is fascinated by identifying changing and unchanging cultural trends such as the appreciation of Hollywoood motion pictures across the globe. As example, she cites that while Korean films have become wildly popular not only in Korea but all of Asia, Koreans still tend to idealize certain A-list Hollywood actors, even those who have lost much of their cache in the U.S. An honors graduate of New York’s Hunter College, Ashley was the only Valedictorian candidate in her class to create her major — Art Philosophy. Throughout her college years she enjoyed the independence of directing her own course of studies, which included reading the French Classics and painting herself in the likeness of Manet’s Olympia, illustrating her interpretation of Baudelaire’s Essay on art, Le Peintre de la vie modern, (The Painter of Modern Life). Astutely aware of how cultures and mores change over time, she was surprised to discover that what was deemed shocking in 19th century Paris was still regarded, by and large, as unseemly within the modern day academia. Trained as a musician, she was the recipient at age 13 of a Non-Course Scholarship for Piano at Queensland Conservatorium of Music in Australia. Ashley’s passion for music continues playing keyboard. She also enjoys traveling and learning new languages, which are simply music to her ears.
|
|
Localspeak international staff and services meet and often exceed the expectations of our clients. Call us today to discuss your in-language coding and translation projects for 2011.

|

|
| localspeak • 15 Broad Street, Suite 904, New York, NY 10005 • 646.370.4987 • www.localspeak.com • candida@localspeak.com |