|
We have written several times in the past about the importance of understanding what season of the economy we are in. Buy and hold makes sense in certain seasons and it is a loser in other seasons.
I want to call your attention to an article from MoneyNews:

Bogle: Buy and Hold Stocks for 7 Percent Return Over Long Term
(Please click to read original article)
For those that don't know, Mr. Bogle is the founder of Vanguard Funds. He has long been a champion of the buy and hold strategy. He bases much of his prediction on the long term averages of the stock market. Because the market has averaged X over the previous long term, you should receive X going forward into the future long term.
I believe this type of thinking leads to unrealistic expectations for stock market returns. Let's take a look at what I mean.
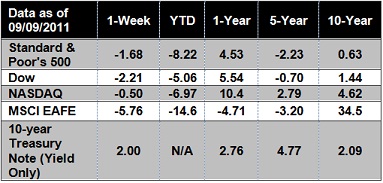
Over the last ten years the Dow Jones Industrial Average has averaged 4.08% (From 8/31/2001 to 8/31/2011 according to Morningstar). That's a far cry from the 7% Mr. Bogle is telling us to expect going forward and it is also a far cry from the long term average of the market over its history.
Anytime you start talking about averages it is important to know the dispersion of the data. What the heck is dispersion? The range of values used to determine the averages. Let me give you an illustration.
Let's say you wanted to determine the average income of a group of people. I have listed two groups below. In the first example below the incomes range from $10,000 to $20,000 with an average income of $13,400. Would you say that the average is truly indicative of the average income for that group? I think most people would say that it is.
Would you say that the average of $108,200 was truly indicative of the average income of group 2? Most people would agree that it is not. Why? Because the guy that makes $500,000 a year through the whole average off. In other words, there is such a wide dispersion of data that it renders the average somewhat meaningless. Does that make sense?

Now let's take a look at some proprietary research that we have done here at Reames Financial. We have gone back and looked at the yearly returns of the Dow Jones Industrial Average dating back to January 1, 1900. I have put together a table of the average annual return for each decade.

As you can see, in the last 11 decades, the DJIA has only averaged 7% or better for the decade four times. None of the other 7 decades have even averaged 5% per year for the decade. This is where I think the dispersion of the data is an issue. You have four really big decades that really skew the averages in my opinion. Is it really smart to expect returns that tend to happen only every three decades or so?
The reason I point this out is that I think it is a more reasonable assumption that we are going to have much lower returns in the markets for the next few years. That is why we believe active management is so important!
If your advisor is still talking to you about the "long term" and the "long term averages" you might want to give us a call!
ECONOMIC CALENDAR:
Tuesday - Import and Export Prices, Treasury Budget
Wednesday -Producer Price Index, Retail Sales, Business Inventories, EIA Petroleum Status Report
Thursday - Consumer Price Index, Empire State Mfg Survey, Jobless Claims, Industrial Production, Philadelphia Fed Survey
Friday - Treasury International Capital, Consumer Sentiment
|