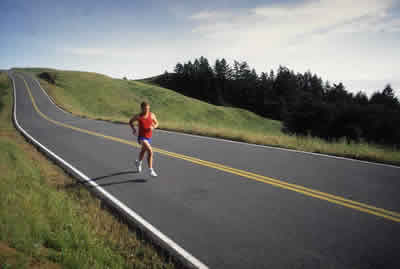
Running/Jogging, which grew by 10.3% in 2010, continued its strong growth in 2011. Data in NSGA's annual "Sports Participation - Series I and II" reports, now available, shows running/jogging with 38.7 million participants in 2011, an increase of 8.9% compared to 35.5 million in 2010. Since the association began surveying running/jogging in 1984 (29.5 million participants), participation has grown by 30.9%.
Among sports and activities with 10 million or more participants, the overall percentage leaders were aerobic exercising and running jogging, both showing an 8.9% increase. Aerobic exercising increased from 38.5 million participants in 2010 to 42.0 million participants in 2011. Tennis (13.1 million) showed a 7.0% increase, followed by yoga (21.6 million), 6.9%; hiking (39.1 million), 3.8%; and backpack/wilderness camping (11.6 million), 3.7%.
The overall percentage leader was kayaking, which showed a 26.6% increase to 7.1 million participants. Several other activities with fewer than 10 million participants showed increases in 2011, including cross country skiing (2.3 million), 11.5%; and target shooting-shotgun (9.5 million), 2.0%.
Among traditional team sports, wrestling led with a strong increase of 9.4% to 3.2 million. Gymnastics continued to increase, up 7.6% to 5.1 million and soccer was up 3.0% to 13.9 million. Among the team sports showing a decline, ice hockey (3.0 million) was down 9.2%; volleyball (10.1 million) down 5.1%; softball (10.4 million) down 4.2%; tackle football (9.0 million) down 3.0%; basketball (26.1 million) down 2.9%; and baseball (12.3 million) down 1.9%. This contrasts with 2010 increases in basketball (10.1%), baseball (8.9%), ice hockey (7.9%), and tackle football (4.8%).
Click here for a chart of overall participation numbers for the sports surveyed.
For this survey, a participant is someone age seven or older who takes part in the sport or activity more than once in a calendar year. "Sports Participation in 2011 -- Series I and II" cover 47 sports, recreation and fitness activities.
These reports have been published by NSGA for more than 25 years. They provide data on total 2011 participation, frequency of participation, and mean (average) and median (mid-point) number of participation days. Single-time participation, which is not counted in the total, is included separately.
Demographic data on participants includes gender, age, mean and median age by gender, gender by age, household income, and education of male and female head of household. Geographic analysis includes nine census regions and metro area size.
For more information and/or pricing for these and other NSGA research reports, please contact the NSGA Research Department, (847) 296-6742, ext. 108, or e-mail: dkasen@nsga.org.