| Volume 2012, Issue 1 | October 10, 2012 |
|

Stanislaus River Salmon Festival:
November 3
|
|
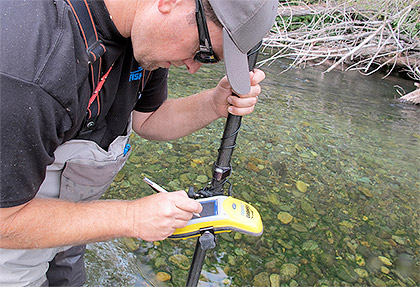
Photo by FISHBIO |
Key Highlights
July 9 - September 30, 2012
Stanislaus River Weir Monitoring resumed on September 11, 2012. A total of 232 Chinook salmon were detected as they passed upstream of the weir between September 11 and September 30.
Tuolumne River Weir Monitoring resumed on September 24, 2012. A total of 58 Chinook salmon were detected as they passed upstream of the weir between September 24 and September 30.
Mokelumne River Woodbridge Dam Fish Ladder Monitoring resumed on August 8, 2012. No Chinook salmon passed upstream of the dam between August 8 and September 30.
San Joaquin River Conditions. San Joaquin River flow at Vernalis ranged from 660 cfs to 1,118 cfs. Daily average water temperature in the San Joaquin River ranged from 70.2°F to 80.6°F at Vernalis, and from 71.0°F to 82.0°F at Mossdale. Daily average dissolved oxygen (DO) in the San Joaquin River ranged from 9.7 mg/L to 15.7 mg/L at Mossdale, and from 5.2 mg/L to 8.0 mg/L in the deep-water ship channel (measured at Rough 'n Ready Island).
Delta Exports. Combined total exports (state and federal pumps) fluctuated during the reporting period, ranging from 6,591 cfs to 11,666 cfs.
|
|
2012 Stanislaus River Weir Adult Migration Monitoring
Monitoring at the Stanislaus River Weir, downstream of Jacob Meyer Park, began immediately after installation was completed on September 11 and is expected to  continue through the fall-run Chinook salmon migration season. A total of 232 Chinook salmon were detected by the Vaki Riverwatcher as they passed upstream through the weir between September 11 and 30 (Figure 1; Table 1). Daily passage ranged between 1 and 45 Chinook salmon. No counts on September 29 and 30 due to a hardware failure.F continue through the fall-run Chinook salmon migration season. A total of 232 Chinook salmon were detected by the Vaki Riverwatcher as they passed upstream through the weir between September 11 and 30 (Figure 1; Table 1). Daily passage ranged between 1 and 45 Chinook salmon. No counts on September 29 and 30 due to a hardware failure.F
Instantaneous water temperature measured at the weir ranged between 61.8˚F and 66.9˚F, and daily average water temperature at Ripon (RPN; RM 15) ranged between 66.9˚F and 70.9˚F (Figure 3). Instantaneous turbidity ranged between 0.99 NTU and 3.75 NTU (Figure 4). Instantaneous dissolved oxygen at the weir ranged between 8.88 mg/L and 10.76 mg/L, and daily average dissolved oxygen at Ripon (RPN; RM 15) ranged from 8.00 mg/L to 8.50 mg/L (Figure 5).
Daily average flows in the Stanislaus River at Goodwin Dam (GDW; RM 58) ranged from 250 cfs to 259 cfs. Flows at Ripon (RIP; RM 15) ranged from 228 cfs to 260 cfs (Figure 2). Note: flows downstream of Goodwin Dam may differ from dam releases due to irrigation, precipitation and other factors.Table 1. Annual fall-run Chinook passage at the Stanislaus River weir prior to September 30, 2003-2012.Figure 1. Cumulative passage of fall-run Chinook salmon recorded at the Stanislaus River weir from 2003-2012.Figure 2. Daily upstream Chinook passage at the Stanislaus River weir in relation to daily average flows (cfs) recorded in the Stanislaus River at Goodwin (GDW) and Ripon (RIP), 2012.Figure 3. Daily upstream Chinook passage recorded at the Stanislaus River weir in relation to instantaneous water temperature recorded at the weir, and daily average water temperature recorded in the Stanislaus River at Ripon (RPN), and in the San Joaquin River at Vernalis (VER), Mossdale (MSD) and Rough & Ready (RRI) in 2012.
Figure 4. Daily upstream Chinook passage at the Stanislaus River weir in relation to instantaneous turbidity recorded at the weir in 2012.Figure 5. Daily upstream Chinook passage at the Stanislaus River weir in relation to instantaneous dissolved oxygen recorded at the weir, and daily average dissolved oxygen recorded in the Stanislaus River at Ripon (RPN), and in the San Joaquin River at Mossdale (MSD) and Rough & Ready (RRI) in 2012.
|
2011 Tuolumne River Weir Adult Migration Monitoring
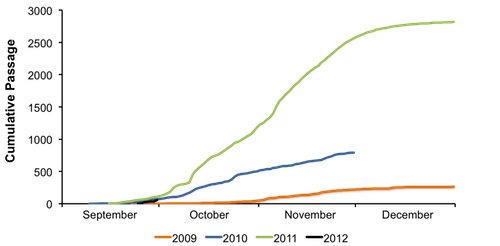
Monitoring at the Tuolumne River Weir, downstream of Fox Grove Fishing Access (RM 24), began immediately after installation was completed on September 24 and is  expected to continue through the fall-run Chinook salmon migration season. A total of 58 Chinook salmon were detected by the Vaki Riverwatcher as they passed upstream through the weir between September 24 and 30 (Figure 6; Table 2). Daily passage ranged between 0 and 22 Chinook salmon. expected to continue through the fall-run Chinook salmon migration season. A total of 58 Chinook salmon were detected by the Vaki Riverwatcher as they passed upstream through the weir between September 24 and 30 (Figure 6; Table 2). Daily passage ranged between 0 and 22 Chinook salmon. Daily average flow in the Tuolumne River ranged from 93 cfs to 128 cfs at La Grange (LGN; RM 50) and 146 cfs and 210 cfs at Modesto (MOD; RM 17) (Figure 7). Note: flows downstream of La Grange may be higher than dam releases due to accretion and Dry Creek inflow. Instantaneous water temperature measured at the weir ranged between 71.9˚F and 75.7˚F and daily average water temperature at Modesto (MOD; RM 17) ranged between 72.5˚F and 76.8˚F (Figure 8). Instantaneous turbidity ranged between 1.71 NTU and 3.47 NTU (Figure 9), and instantaneous dissolved oxygen ranged between 7.83 mg/L and 9.04 mg/L (Figure 10). Table 2. Annual Fall-run Chinook passage prior to September 30, 2009 - 2012.
Figure 6. Fall-Run Chinook salmon cumulative passage recorded at the Tuolumne River weir in 2009 - 2012.
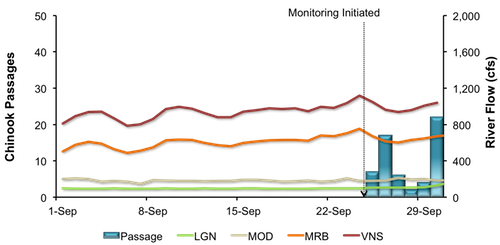
Figure 7. Daily upstream Chinook passage at the Tuolumne River Weir in relation to daily average flows (cfs) recorded in the Tuolumne River at La Grange (LGN) and Modesto (MOD), and in the San Joaquin River at Vernalis (VNS) in 2012.

Figure 8. Daily upstream Chinook passage at the Tuolumne River Weir in relation to instantaneous water temperature recorded at the weir, and daily average water temperature recorded in the Tuolumne River at Modesto (MOD) and in the San Joaquin River at Vernalis (VER), Mossdale (MSD) and Rough & Ready (RRI) in 2012.
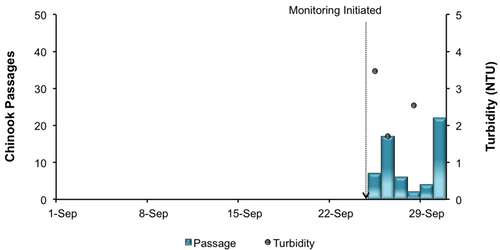
Figure 9. Daily upstream Chinook passage at the Tuolumne River Weir in relation to instantaneous turbidity recorded at the weir in 2012.
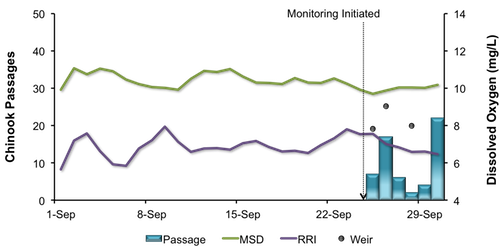
Figure 10. Daily upstream Chinook passage at the Tuolumne River Weir in relation to instantaneous dissolved oxygen recorded at the weir, and daily average dissolved oxygen recorded in the San Joaquin River at Mossdale (MSD) and Rough & Ready (RRI) in 2012.
|
Mokelumne River Woodbridge Dam Fish Ladder Monitoring Fall-run Chinook salmon returning to the Mokelumne are counted annually by East Bay Municipal Utility District (EBMUD) as they ascend the fish ladder at Woodbridge Dam. Video monitoring began on August 8 and continued through September 30. No Chinook salmon were observed passing upstream of the dam (Figure 8). During the reporting period, daily average flow in the Mokelumne River fluctuated between 270 and 323 cfs at Camanche Reservoir (CMN) and between 38 cfs and 50 cfs at Woodbridge Dam (WBR).
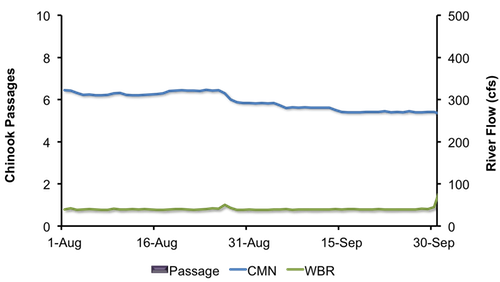
Figure 11. Daily upstream Chinook passage recorded at the Woodbridge Dam fish ladder in relation to daily average flows (cfs) recorded in the Mokelumne River at Camanche Reservoir (CMN), 2012.
|
San Joaquin River Conditions
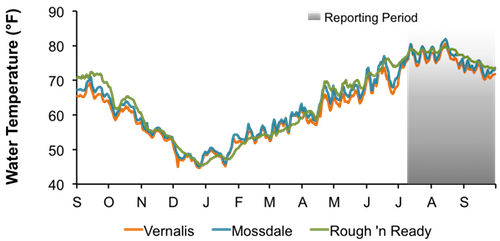
During the reporting period, flow in the San Joaquin River at Vernalis fluctuated from 660 cfs to 1,118 cfs (Figure 12). Water temperature in the San Joaquin River ranged from 70.2°F to 80.6°F at Vernalis, from 71.0°F to 82.0°F at Mossdale, and from 73.4°F to 79.7°F at Rough 'n Ready Island (Figure 13). Average daily dissolved oxygen (DO) in the San Joaquin River fluctuated from 5.2 mg/L to 8.0 mg/L in the deep-water ship channel (measured at Rough 'n Ready Island), and from 9.7 mg/L to 15.7 mg/L at Mossdale (Figure 14).

Figure 12. San Joaquin River flow at Vernalis from September 1, 2011, through September 30, 2012.
Figure 13. San Joaquin River daily average water temperature at Vernalis, Mossdale, and Rough 'n Ready from September 1, 2011, through September 30, 2012.
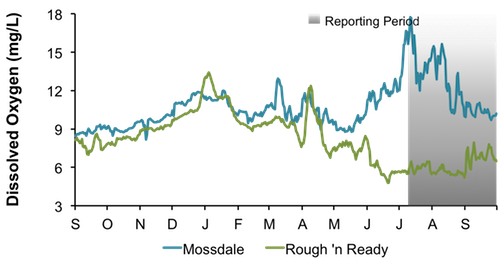
Figure 14. San Joaquin River daily average dissolved oxygen at Mossdale and Rough 'n Ready, from September 1, 2011, through September 30, 2012.
|
Delta Exports
Mean daily pumping at the C.W. Jones Pumping Plant (federal pumps previously known as Tracy Pumping Plant) ranged from 3,260 cfs to 4,469 cfs (Figure 12). Mean daily pumping at the Harvey O. Banks Pumping Plant (state pumps) ranged from 3,331 cfs to 7,309 cfs. Combined total exports (state and federal pumps) during this period ranged from 6,591 cfs to 11,666 cfs.
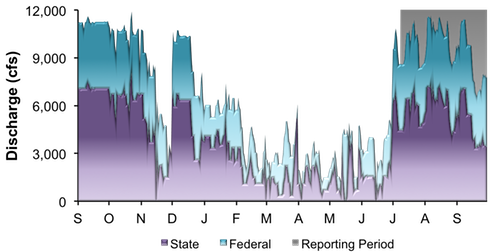
Figure 15. Daily exports at the state and federal pumping stations from September 1, 2011, through September 30, 2012.
|
|
|
|
|
|
|