| Volume 2012, Issue 21 | July 17, 2012 |
|

Joint Meeting of Ichthyologists & Herpetologists:
August 8-14
142nd Annual AFS Meeting:
August 19-23
10th International Seafood Summit:
September 6-8
|
|

|
Key Highlights
June 25, 2012 - July 8, 2012
Calaveras River Juvenile Migration Monitoring ended at Shelton Road (RM 28) on July 7. A total of 22 O. mykiss were captured, increasing the season total to 826. A total of eight Chinook salmon were also captured, bringing the season total to 2,294.
Stanislaus River Juvenile Migration Monitoring ended at Oakdale (RM 40) on July 6. A total of 33 Chinook salmon were captured, increasing the season total to 26,060. A total of eight O. mykiss were captured, increasing the season total to 121. Monitoring at Caswell State Park (RM 8) ended on July 3. A total of 3 Chinook salmon were captured, increasing the season total to 1,198.
Mokelumne River Juvenile Migration Monitoring ended at Vino Farms (RM 54) on June 29. A total of two Chinook salmon was captured, increasing the season total to 12,443. Two O. mykiss were captured, increasing the season total to 60. Monitoring at the Bypass trap (RM 38) continued and a total of 129 Chinook salmon were captured, increasing the season total to 7,673. A total of 17 O. mykiss were captured, increasing the season total to 124.
San Joaquin River Conditions. San Joaquin River flow at Vernalis ranged from 840 cfs to 1,705 cfs. Daily average water temperature in the San Joaquin River ranged from 66.1°F to 75.5°F at Vernalis, and from 68.0°F to 76.6°F at Mossdale. Daily average dissolved oxygen (DO) in the San Joaquin River ranged from 11.9 mg/L to 16.7 mg/L at Mossdale, and from 5.5 mg/L to 5.7 mg/L in the deep-water ship channel (measured at Rough 'n Ready Island).
Delta Exports. Combined total exports (state and federal pumps) fluctuated during the reporting period, ranging from 4,120 cfs to 10,834cfs.
|
|
2011/12 Calaveras River Juvenile Migration Monitoring
The Calaveras River rotary screw trap at Shelton Road (RM 28) ended sampling on July 7. A total of 22 O. mykiss were captured, increasing the season total to 826. 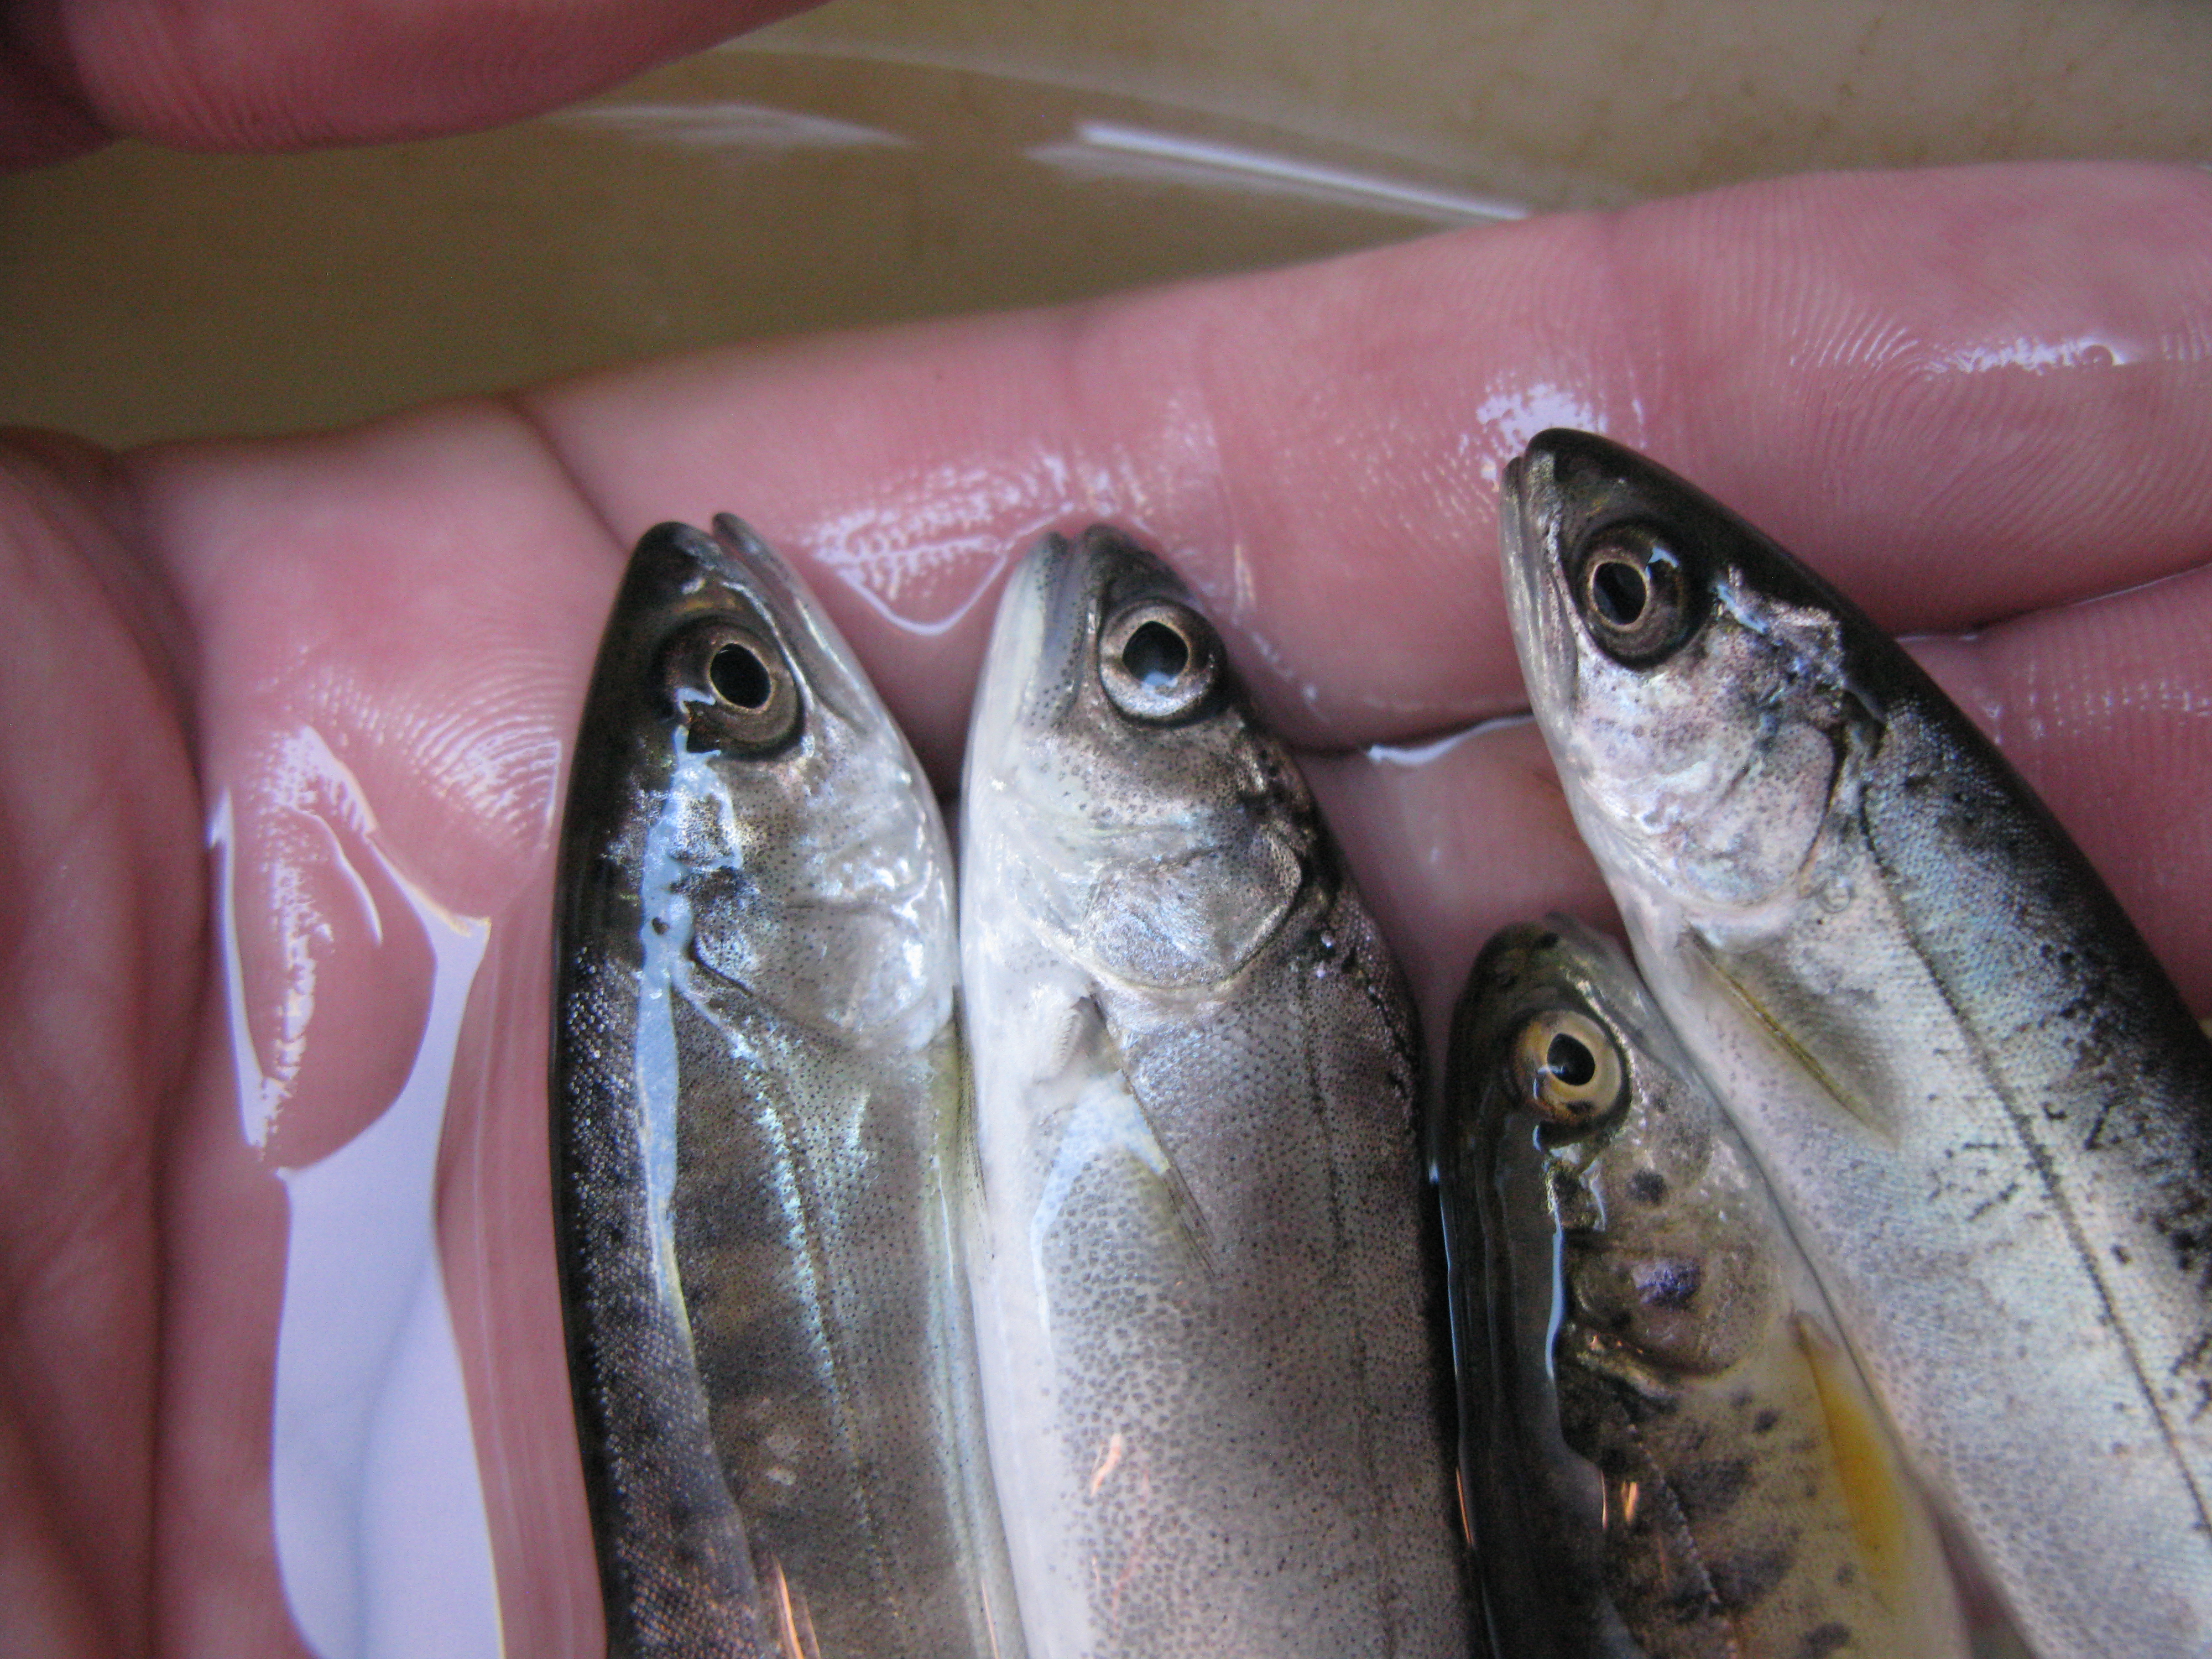 Daily catch ranged from 0 to 6 individuals (Figure 1). Average forklengths and weights for 22 O. mykiss are provided in Table 1. Most of the O. mykiss measured were YOY (<100 mm), and were rated as parr (n=3) and silvery parr (n=10), but Age 1+ (100-299 mm) were also observed and rated as silvery parr (n=9). Daily catch ranged from 0 to 6 individuals (Figure 1). Average forklengths and weights for 22 O. mykiss are provided in Table 1. Most of the O. mykiss measured were YOY (<100 mm), and were rated as parr (n=3) and silvery parr (n=10), but Age 1+ (100-299 mm) were also observed and rated as silvery parr (n=9).
A total of 8 Chinook salmon were captured during the reporting period, increasing the season total to 2,294.Daily catch ranged between 0 and 2 Chinook (Figure 2). All Chinook salmon measured were smolt (n=8). Average forklengths and weights are provided in Table 1.
Daily average combined flows from New Hogan Dam (NHG) and Cosgrove Creek (COS) fluctuated between 158 cfs and 250 cfs, and at Bellota (MRS) flows ranged from 24 cfs to 49 cfs (Figure 3). Instantaneous water temperatures recorded at the trap ranged from 56.4ºF to 59.5ºF, and turbidity ranged from 0.80 NTU to 2.51 NTU.
No trap efficiency experiments were conducted during the reporting period.
Table 1. Biosampling data for salmonids captured at Shelton Road (RM 28) between June 25 and July 7, 2012. Parenthesis indicates range.
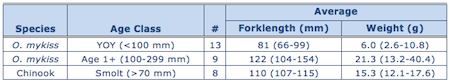
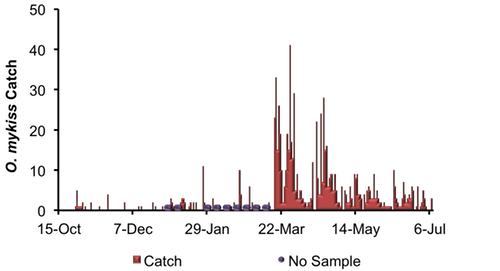
Figure 1. Daily O. mykiss catch at Shelton Road between October 15, 2011, and July 8, 2012.
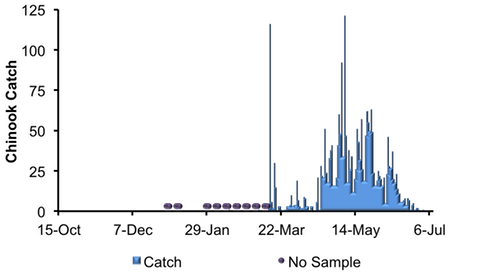
Figure 2. Daily Chinook salmon catch at Shelton Road between October 15, 2011, and July 8, 2012.
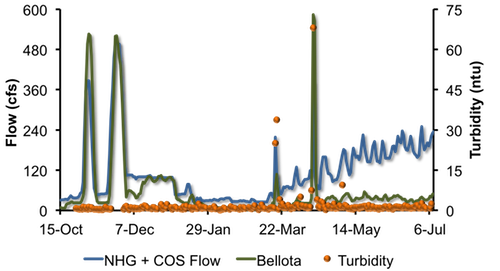
Figure 3. Daily Calaveras River flows recorded at New Hogan Dam and Cosgrove Creek combined (NHG + COS) and at Bellota (MRS) and turbidity recorded at the trap between October 15, 2011, and July 8, 2012.
|
2011/12 Stanislaus River Juvenile Migration Monitoring
The Stanislaus River rotary screw trap at Oakdale (RM 40) ended sampling on July 6.  A total of 33 Chinook salmon were captured, increasing the season total to 26,060. Daily catch ranged between 2 and 6 Chinook (Figure 4). All Chinook salmon measured were smolt (n=33) and average forklengths and weights are provided in Table 2. A total of 33 Chinook salmon were captured, increasing the season total to 26,060. Daily catch ranged between 2 and 6 Chinook (Figure 4). All Chinook salmon measured were smolt (n=33) and average forklengths and weights are provided in Table 2.
A total of 8 O. mykiss were captured during the reporting period, increasing the season total to 121. Most of the O. mykiss measured were YOY (<100 mm), and were rated as parr (n=1) and silvery parr (n=5), but Age 1+ (100-299 mm) were also observed and rated as silvery parr (n=2).
Table 2. Biosampling data for salmonids captured and measured at Oakdale (RM 40) between June 25 and July 6, 2012.
 No trap efficiency experiments were conducted during the reporting period. Daily average flows at Goodwin Dam (GDW) decreased from 1,271 cfs to 408 cfs. Instantaneous water temperatures taken at the trap ranged from 56.1ºF to 58.6ºF, and turbidity ranged from 0.48 NTU to 2.38 NTU.
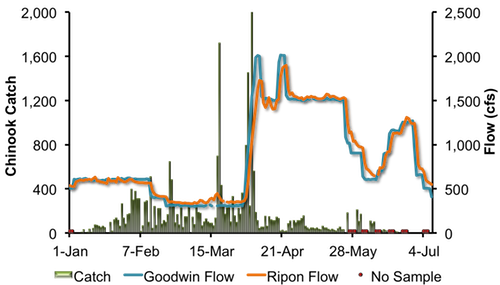
Figure 4. Daily Chinook salmon catch at Oakdale (RM 40) and daily average Stanislaus River flows at Goodwin Dam (GDW) and Ripon (RIP) between January 1, 2012, and July 8, 2012.
The Stanislaus River rotary screw trap at Caswell State Park (RM 8) ended sampling on July 3. A total of 3 juvenile Chinook salmon were captured, increasing the season total to 1,198.
Instantaneous temperature recorded at the trap ranged from 61.2°F and 65.5°F, and turbidity ranged from 2.71 NTU to 4.21 NTU. Daily average flow at Ripon (RIP) decreased from 1,312 cfs to 553 cfs.
|
2011/12 Mokelumne River Juvenile Migration Monitoring
The Mokelumne River rotary screw trap at Vino Farms (RM 54) sampling ended on June 29. Two juvenile Chinook salmon were captured, bringing the season total to 12,443 (Figure 5).
Two O. mykiss were captured, increasing the season total to 60.
Daily average flows from Camanche Reservoir (CMN) ranged from 260 cfs to 267 cfs. Instantaneous water temperatures ranged between 51.8°F and 58.8°F, and instantaneous turbidity ranged between 1.59 NTU and 2.42 NTU.
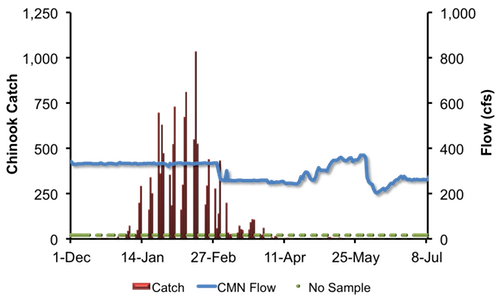 Figure 5. Daily juvenile Chinook catch at Vino Farms (RM 54) and daily average Mokelumne River flows at Camanche Reservoir (CMN) between December 1, 2011, and July 8, 2012. The Mokelumne River Bypass trap (RM 38) sampled intermittently between June 25 and July 8. A total of 129 juvenile Chinook salmon were captured during the reporting period, increasing the season total to 7,673. A total of 17 O. mykiss were captured during the reporting period, increasing the season total to 124. Daily average flows recorded at Woodbridge (WBR) ranged from 40 cfs to 52 cfs (Figure 6). Instantaneous water temperatures ranged between 67.6°F and 72.3°F, and turbidity ranged between 2.12 NTU and 3.35 NTU. 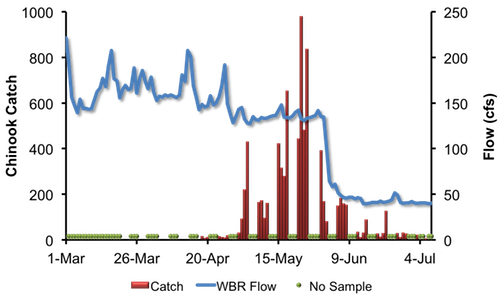
Figure 6. Daily juvenile Chinook catch at the Bypass trap (RM 38) and daily average Mokelumne River flows at Woodbridge (WBR), between March 1, 2012, and July 8, 2012.
|
San Joaquin River Conditions
During the reporting period, flow in the San Joaquin River at Vernalis decreased from 1,705 cfs to 840 cfs (Figure 7). Daily average water temperature in the San Joaquin River ranged from 66.1°F to 75.5°F at Vernalis, from 68.0°F to 76.6°F at Mossdale, and from 73.9°F to 76.8°F at Rough 'n Ready Island (Figure 8). Daily average dissolved oxygen (DO) in the San Joaquin River fluctuated from 11.9 mg/L to 16.7mg/L at Mossdale, and from 5.5 mg/L to 5.7 mg/L in the deep-water ship channel (measured at Rough 'n Ready Island; Figure 9).

Figure 7. San Joaquin River flows at Vernalis between July 1, 2011, and July 8, 2012.
Figure 8. San Joaquin River daily average water temperature at Vernalis, Mossdale, and Rough 'n Ready between July 1, 2011, and July 8, 2012.

Figure 9. San Joaquin River daily average dissolved oxygen at Mossdale and Rough 'n Ready between July 1, 2011, and July 8, 2012.
|
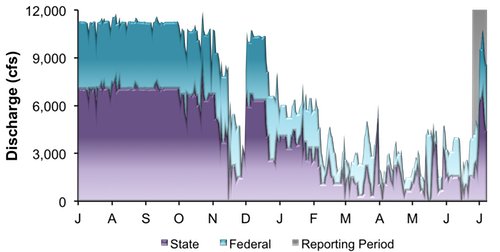
Delta ExportsMean daily pumping at the C.W. Jones Pumping Plant (federal pumps previously known as Tracy Pumping Plant) ranged from 2,582 cfs to 4,169 cfs (Figure 10). Mean daily pumping at the Harvey O. Banks Pumping Plant (state pumps) fluctuated between 1,482 cfs to 6,719 cfs. Combined total exports (state and federal pumps) fluctuated during this reporting period, ranging from 4,120 cfs to 10,834 cfs.
Figure 10. Daily exports at the state and federal pumping stations between July 1, 2011, and July 8, 2012.
|
|
|
|
|
|
|