| Volume 2012, Issue 20 | July 3, 2012 |
|

Joint Meeting of Ichthyologists & Herpetologists:
August 8-14
142nd Annual AFS Meeting:
August 19-23
10th International Seafood Summit:
September 6-8
|
|

|
Key Highlights
June 11, 2012 - June 24, 2012
Calaveras River Juvenile Migration Monitoring continued at Shelton Road (RM 28) and a total of 60 O. mykiss were captured, increasing the season total to 804. A total of 124 Chinook salmon were also captured, bringing the season total to 2,286.
Stanislaus River Juvenile Migration Monitoring continued at Oakdale (RM 40) and a total of 127 Chinook salmon were captured, increasing the season total to 26,027. A total of 31 O. mykiss were captured, increasing the season total to 113. Monitoring at Caswell State Park (RM 8) continued and a total of 11 Chinook salmon were captured, increasing the season total to 1,195.
Tuolumne River Juvenile Migration Monitoring ended at Waterford (RM 30) on June 15, and one Chinook salmon was captured, increasing the season total to 3,626. No O. mykiss were captured and the total remains at one. Monitoring at Grayson (RM 5) also ended on June 15 and no Chinook salmon were captured. Season total remains at 82. No O. mykiss were captured this season at Grayson.
Mokelumne River Juvenile Migration Monitoring continued at Vino Farms (RM 54) and one Chinook salmon was captured, increasing the season total to 12,441. Four O. mykiss were captured, increasing the season total to 58. Monitoring at the Bypass trap (RM 38) also continued and a total of 367 Chinook salmon were captured, increasing the season total to 7,544. A total of 29 O. mykiss were captured, increasing the season total to 107.
San Joaquin River Juvenile Migration Monitoring. The California Department of Fish and Game (CDFG) continued Kodiak Trawling on the San Joaquin River near Mossdale. A total of 5 Chinook salmon were captured, increasing the season total to 3,213.
Tuolumne River Weir Monitoring (RM 22) ended on June 22. No Chinook salmon or O. mykiss passed upstream through the weir during the reporting. Season totals remain at 2,904 and 16, respectively.
San Joaquin River Conditions. San Joaquin River flow at Vernalis ranged from 1,176 cfs to 1,634 cfs. Daily average water temperature in the San Joaquin River ranged from 66.5°F to 73.7°F at Vernalis, and from 68.4°F to 77.0°F at Mossdale. Daily average dissolved oxygen (DO) in the San Joaquin River ranged from 11.2 mg/L to 12.6 mg/L at Mossdale, and from 4.8 mg/L to 6.1 mg/L in the deep-water ship channel (measured at Rough 'n Ready Island).
Delta Exports. Combined total exports (state and federal pumps) fluctuated during the reporting period, ranging from 1,003 cfs to 4,016 cfs.
|
|
2011/12 Calaveras River Juvenile Migration Monitoring
The Calaveras River rotary screw trap at Shelton Road (RM 28) sampled continuously between June 11 and June 24. A total of 60 O. mykiss were captured, increasing the season total to 804. Daily catch ranged from 1 to 7 individuals (Figure 1). Average forklengths and weights for 58 O. mykiss are provided in Table 1. Most of the O. mykiss measured were YOY (<100 mm), and were rated as parr (n=9) and silvery parr (n=25), but Age 1+ (100-299 mm) were also observed and rated as parr (n=1), silvery parr (n=20), and smolts (n=1).
 A total of 124 Chinook salmon were captured during the reporting period, increasing the season total to 2,286.Daily catch ranged between 1 and 23 Chinook (Figure 2). All Chinook salmon measured were smolts (n=124). Average forklengths and weights are provided in Table 1. A total of 124 Chinook salmon were captured during the reporting period, increasing the season total to 2,286.Daily catch ranged between 1 and 23 Chinook (Figure 2). All Chinook salmon measured were smolts (n=124). Average forklengths and weights are provided in Table 1.
Daily average combined flows from New Hogan Dam (NHG) and Cosgrove Creek (COS) fluctuated between 175 cfs and 237 cfs, and at Bellota (MRS) flows ranged from 26 cfs to 45 cfs (Figure 3). Instantaneous water temperatures recorded at the trap ranged from 56.1ºF to 60.7ºF, and turbidity ranged from 0.66 NTU to 1.69 NTU.
No trap efficiency experiments were conducted during the reporting period.
Table 1. Biosampling data for salmonids captured at Shelton Road (RM 28) between June 11 and June 24, 2012. Parenthesis indicates range.


Figure 1. Daily O. mykiss catch at Shelton Road between October 15, 2011, and June 24, 2012.

Figure 2. Daily Chinook salmon catch at Shelton Road between October 15, 2011, and June 24, 2012.
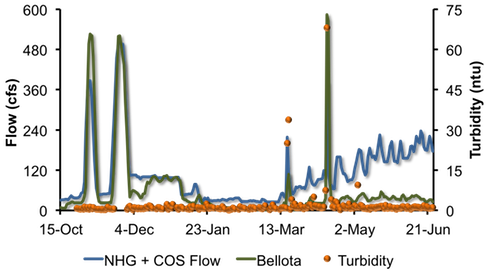
Figure 3. Daily Calaveras River flows recorded at New Hogan Dam and Cosgrove Creek combined (NHG + COS) and at Bellota (MRS) and turbidity recorded at the trap between October 15, 2011, and June 24, 2012.
|
2011/12 Stanislaus River Juvenile Migration Monitoring
 The Stanislaus River rotary screw trap at Oakdale (RM 40) sampled continuously between June 11 and June 24. A total of 127 Chinook salmon were captured, increasing the season total to 26,027. Daily catch ranged between 4 and 33 Chinook (Figure 4). Most of the Chinook salmon measured were smolt (n=124), but parr (n=2) were also observed. Average forklengths and weights of all measured Chinook salmon are provided in Table 2. The Stanislaus River rotary screw trap at Oakdale (RM 40) sampled continuously between June 11 and June 24. A total of 127 Chinook salmon were captured, increasing the season total to 26,027. Daily catch ranged between 4 and 33 Chinook (Figure 4). Most of the Chinook salmon measured were smolt (n=124), but parr (n=2) were also observed. Average forklengths and weights of all measured Chinook salmon are provided in Table 2.
A total of 31 O. mykiss were captured during the reporting period, increasing the season total to 113.
Table 2. Biosampling data for salmonids captured and measured at Oakdale (RM 40) between June 11 and June 24, 2012.
 No trap efficiency experiments were conducted during the reporting period. Daily average flows at Goodwin Dam (GDW) increased from 701 cfs to 1,254 cfs, and at Ripon (RIP) increased from 738 cfs to 1,256 cfs.Instantaneous water temperatures taken at the trap ranged from 55.4ºF to 58.2ºF, and turbidity ranged from 1.08 NTU to 2.51 NTU. 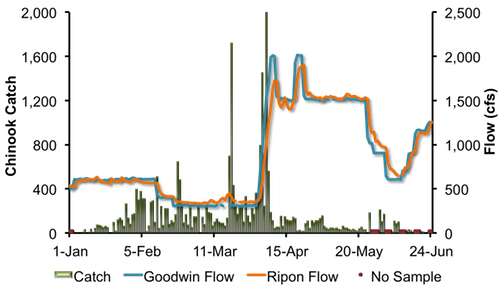
Figure 4. Daily Chinook salmon catch at Oakdale (RM 40) and daily average Stanislaus River flows at Goodwin Dam (GDW) and Ripon (RIP) between January 1, 2012, and June 24, 2012.
The Stanislaus River rotary screw trap at Caswell State Park (RM 8) sampled intermittently between June 11 and June 24. A total of 11 juvenile Chinook salmon were captured, increasing the season total to 1,195.
Instantaneous temperature recorded at the trap ranged from 62.2°F and 67.8°F, and turbidity ranged from 2.12 NTU to 4.26 NTU. Daily average flow at Ripon (RIP) increased from to 701 cfs to 1,254 cfs.
|
2012 Tuolumne River Juvenile Migration Monitoring
 The Tuolumne River rotary screw trap at Waterford (RM 30) ended sampling on June 15. One juvenile Chinook salmon was captured, increasing the season total to 3,626 (Figure 5). Average forklength and weight is provided for the smolt size Chinook salmon in Table 3. The Tuolumne River rotary screw trap at Waterford (RM 30) ended sampling on June 15. One juvenile Chinook salmon was captured, increasing the season total to 3,626 (Figure 5). Average forklength and weight is provided for the smolt size Chinook salmon in Table 3.
No O. mykiss were captured during the reporting period.
Table 3. Biosampling data for Chinook salmon captured and measured at Waterford (RM 30) between June 11 and June 15, 2012. Parentheses indicate range.
No trap efficiency experiments were conducted.
Daily average flows at La Grange (LGN) ranged from 94 cfs to 114 cfs during the reporting period. Instantaneous water temperatures taken at the trap ranged from 71.2ºF to 77.3ºF, and turbidity ranged from 1.04 NTU to 1.75 NTU. Figure 5. Daily Chinook salmon catch at Waterford (RM 30) and daily average Tuolumne River flows at La Grange (LGN) and between December 1, 2011, and June 24, 2012. The Tuolumne River rotary screw traps at Grayson (RM 5) ended sampling on June 15. No Chinook salmon were captured during the reporting period. Season total remains at 82. No O. mykiss have been captured this season. No trap efficiency experiments were conducted. Daily average flow at Modesto (MOD) ranged from 203 cfs to 240 cfs (Figure 6). Instantaneous water temperatures taken at the trap ranged from 72.3ºF to 81.1ºF, and turbidity ranged from 2.38 NTU to 3.43 NTU.
Figure 6. Daily Chinook salmon catch at Grayson and Tuolumne River flow recorded at Modesto (MOD) between January 1 and June 24, 2012.
|
2011/12 Mokelumne River Juvenile Migration Monitoring
The Mokelumne River rotary screw trap at Vino Farms (RM 54) sampled intermittently between June 11 and June 24. One juvenile Chinook salmon was captured, bringing the season total to 12,441 (Figure 7).
Four O. mykiss were captured, increasing the season total to 58.
Daily average flows from Camanche Reservoir (CMN) ranged from 215 cfs to 277 cfs. Instantaneous water temperatures ranged between 57.9°F and 60.6°F, and instantaneous turbidity ranged between 1.66 NTU and 4.39 NTU.
 Figure 7. Daily juvenile Chinook catch at Vino Farms (RM 54) and daily average Mokelumne River flows at Camanche Reservoir (CMN) between December 1, 2011, and June 24, 2012. The Mokelumne River Bypass trap (RM 38) sampled intermittently between June 11 and June 24. A total of 367 juvenile Chinook salmon were captured during the reporting period, increasing the season total to 7,544. A total of 29 O. mykiss were captured during the reporting period, increasing the season total to 107. Daily average flows recorded at Woodbridge (WBR) ranged from 39 cfs to 46 cfs (Figure 8). Instantaneous water temperatures ranged between 69.4°F and 73.9°F, and turbidity ranged between 1.94 NTU and 3.35 NTU.
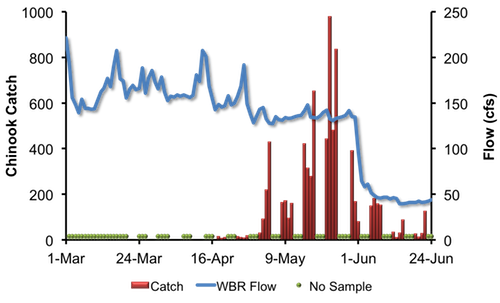
Figure 8. Daily juvenile Chinook catch at the Bypass trap (RM 38) and daily average Mokelumne River flows at Woodbridge (WBR), between March 1, 2012, and June 24, 2012.
|
2012 San Joaquin River Juvenile Migration Monitoring
Kodiak trawling conducted by the California Department of Fish and Game on the San Joaquin River near Mossdale (i.e. the Mossdale Trawl) continued during the reporting period. Seven days (ten tows per day) of trawling were conducted and a total of 5 juvenile Chinook salmon were captured, increasing the season total to 3,213. Catch ranged between 0 and 3 Chinook per 10 tows (Figure 9).
No O. mykiss were captured during the reporting period. Season total remains at 17.
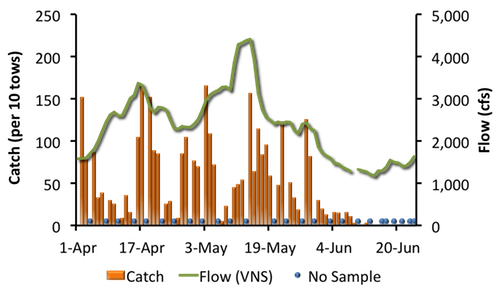
Figure 9. Chinook salmon catch (per 10 tows) at the Mossdale Trawl and San Joaquin River flow recorded by Vernalis (VNS), 2012.
|
2011 Tuolumne River Weir Adult Migration Monitoring
The Tuolumne River Weir and Vaki Riverwatcher (RM 22) monitoring ended June 22. No Chinook salmon were detected between June 11 and June 22. Preliminary passages recorded during the 2011/2012 monitoring season totaled 2,904. Final numbers will be submitted in the year-end report.
No O. mykiss were detected passing upstream of the weir during the reporting period. The season total remains at 16.
Other fish passing upstream of the weir included 7 Catfish and 56 Sacramento suckers (Table 4).
Daily average flows in the Tuolumne River ranged from 94 cfs to 114 cfs at La Grange (LGN; RM 50) and from 203 cfs to 240 cfs at Modesto (MOD; RM 17). Note: flows downstream of La Grange may be higher than dam releases due to accretion and Dry Creek inflows (Figure 10). Instantaneous water temperatures measured at the weir ranged from 71.2˚F and 82.2˚F and daily average water temperatures at Modesto ranged from 73.6˚F and 81.9˚F (Figure 11). Instantaneous turbidity at the weir ranged between 0.54 NTU and 1.87 NTU (Figure 12), and dissolved oxygen ranged between 7.49 mg/L and 11.05 mg/L (Figure 13).
Table 4. Net passage counts for all species between June 11 and June 22, 2012 at the Tuolumne River (RM 22).
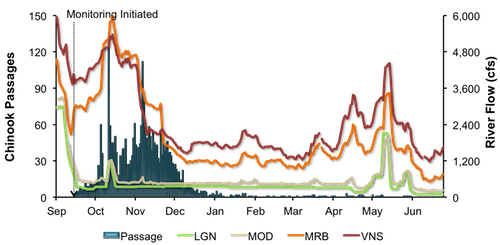
Figure 10. Daily upstream Chinook passage at the Tuolumne River weir in relation to daily average flows (cfs) recorded in the Tuolumne River at La Grange (LGN) and Modesto (MOD), and in the San Joaquin River at Maze Road Bridge (MRB) and Vernalis (VNS), September 1, 2011 and June 24, 2012.
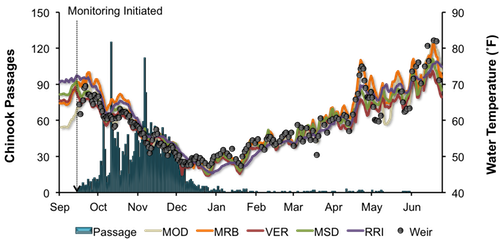
Figure 11. Daily upstream Chinook passage at the Tuolumne River weir in relation to instantaneous water temperature recorded at the weir, and daily average water temperature recorded in the Tuolumne River at Modesto (MOD) and in the San Joaquin River at Maze Road Bridge (MRB), Vernalis (VER), Mossdale (MSD) and Rough & Ready (RRI), September 1, 2011 and June 24, 2012.
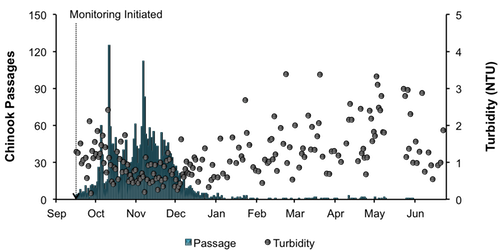
Figure 12. Daily upstream Chinook passage at the Tuolumne River weir in relation to instantaneous turbidity recorded at the weir, September 1, 2011 and June 24, 2012.

Figure 13. Daily upstream Chinook passage at the Tuolumne River weir in relation to instantaneous dissolved oxygen recorded at the weir, and daily average dissolved oxygen recorded in the San Joaquin River at Mossdale (MSD) and Rough & Ready (RRI), September 1, 2011 and June 24, 2012.
|
San Joaquin River Conditions
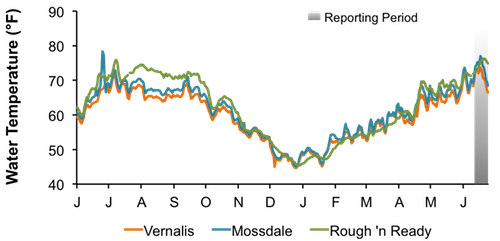
During the reporting period, flow in the San Joaquin River at Vernalis ranged from 1,176 cfs to 1,634 cfs (Figure 15). Daily average water temperature in the San Joaquin River ranged from 66.5°F to 73.7°F at Vernalis, from 68.4°F to 77.0°F at Mossdale, and from 72.0°F to 76.3°F at Rough 'n Ready Island (Figure 16). Daily average dissolved oxygen (DO) in the San Joaquin River fluctuated from 11.2 mg/L to 12.6 mg/L at Mossdale, and from 4.8 mg/L to 6.1 mg/L in the deep-water ship channel (measured at Rough 'n Ready Island; Figure 17).
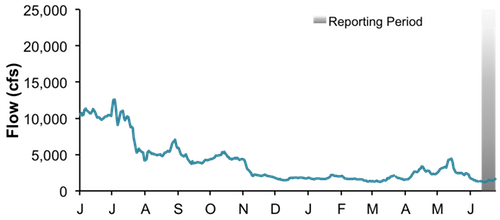
Figure 14. San Joaquin River flows at Vernalis between June 1, 2011, and June 24, 2012.
Figure 15. San Joaquin River daily average water temperature at Vernalis, Mossdale, and Rough 'n Ready between June 1, 2011, and June 24, 2012.
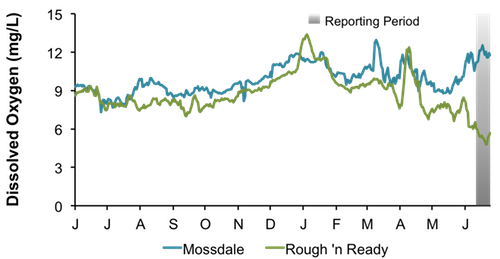
Figure 16. San Joaquin River daily average dissolved oxygen at Mossdale and Rough 'n Ready between June 1, 2011, and June 24, 2012.
|
Delta ExportsMean daily pumping at the C.W. Jones Pumping Plant (federal pumps previously known as Tracy Pumping Plant) ranged from 821 cfs to 2,467 cfs (Figure 18). Mean daily pumping at the Harvey O. Banks Pumping Plant (state pumps) fluctuated between 182 cfs to 1,553 cfs. Combined total exports (state and federal pumps) fluctuated during this reporting period, ranging from 1,003 cfs to 4,016 cfs.
Figure 17. Daily exports at the state and federal pumping stations between June 1, 2011, and June 24, 2012.
|
|
|
|
|
|
|