| Volume 2012, Issue 19 | June 19, 2012 |
|

PFMC Council Meeting:
June 21-26
Joint Meeting of Ichthyologists & Herpetologists:
August 8-14
|
|

|
Key Highlights
May 28, 2012 - June 10, 2012
Calaveras River Juvenile Migration Monitoring continued at Shelton Road (RM 28) and a total of 33 O. mykiss were captured, increasing the season total to 744. A total of 325 Chinook salmon were also captured, bringing the season total to 2,162.
Stanislaus River Juvenile Migration Monitoring continued at Oakdale (RM 40) and a total of 806 Chinook salmon were captured, increasing the season total to 25,900. A total of 35 O. mykiss were captured, increasing the season total to 82. Information is not available from monitoring at Caswell State Park (RM 8).
Tuolumne River Juvenile Migration Monitoring continued at Waterford (RM 30) and a total of 22 Chinook salmon were captured, increasing the season total to 3,625. The first O. mykiss of the season was captured on June 2. Monitoring also continued at Grayson (RM 5), and no Chinook salmon were captured. Season total remains at 82. No O. mykiss have been captured this season at Grayson.
Mokelumne River Juvenile Migration Monitoring continued at Vino Farms (RM 54) and a total of 11 Chinook salmon were captured, increasing the season total to 12,440. Four O. mykiss were captured, increasing the season total to 54. Monitoring at the Bypass trap (RM 38) also continued and a total of 1,288 Chinook salmon were captured, increasing the season total to 7,177. A total of 37 O. mykiss were captured, increasing the season total to 78.
San Joaquin River Juvenile Migration Monitoring. The California Department of Fish and Game (CDFG) continued Kodiak Trawling on the San Joaquin River near Mossdale. A total of 332 Chinook salmon were captured, increasing the season total to 3,208.
Tuolumne River Weir Monitoring (RM 22) continued and a total of 2 Chinook salmon passed upstream through the weir, increasing the season total to 2,904. No O. mykiss passed upstream through the weir during the reporting period, increasing the season total to 16.
San Joaquin River Conditions. San Joaquin River flow at Vernalis decreased from 2,440 cfs to 1,286 cfs. Daily average water temperature in the San Joaquin River ranged from 65.5°F to 71.6°F at Vernalis, and from 66.7°F to 73.7°F at Mossdale. Daily average dissolved oxygen (DO) in the San Joaquin River ranged from 9.8 mg/L to 12.0 mg/L at Mossdale, and from 6.0 mg/L to 8.4 mg/L in the deep-water ship channel (measured at Rough 'n Ready Island).
Delta Exports. Combined total exports (state and federal pumps) fluctuated during the reporting period, ranging from 1,547 cfs to 4,759 cfs.
|
|
2011/12 Calaveras River Juvenile Migration Monitoring
The Calaveras River rotary screw trap at Shelton Road (RM 28) sampled continuously between May 28 and June 10. A total of 33 O. mykiss were captured, increasing the  season total to 744. Daily catch ranged from 0 to 10 individuals (Figure 1). Average forklengths and weights are provided in Table 1. Almost all of the O. mykiss measured were YOY (<100 mm), and were rated as parr (n=10) and silvery parr (n=18), but Age 1+ (100-299 mm) were also observed and rated as silvery parr (n=5). season total to 744. Daily catch ranged from 0 to 10 individuals (Figure 1). Average forklengths and weights are provided in Table 1. Almost all of the O. mykiss measured were YOY (<100 mm), and were rated as parr (n=10) and silvery parr (n=18), but Age 1+ (100-299 mm) were also observed and rated as silvery parr (n=5).
A total of 325 Chinook salmon were captured during the reporting period, increasing the season total to 2,162.Daily catch ranged between 5 and 46 Chinook (Figure 2). All measured Chinook salmon were smolts (n=325). Average forklengths and weights are provided in Table 1.
Daily average combined flows from New Hogan Dam (NHG) and Cosgrove Creek (COS) fluctuated between 142 cfs and 207 cfs, and at Bellota (MRS) flows ranged from 30 cfs to 46 cfs (Figure 3). Instantaneous water temperatures recorded at the trap ranged from 53.7ºF to 60.0ºF, and turbidity ranged from 0.38 NTU to 1.41 NTU.
One trap efficiency experiment was conducted with naturally spawned juvenile Chinook salmon. A preliminary estimate of capture efficiency is provided in Table 2.
Table 1. Biosampling data for salmonids captured at Shelton Road (RM 28) between May 28 and June 10, 2012. Parenthesis indicates range.
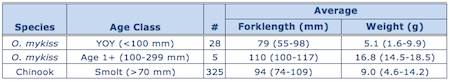 Table 2. Trap efficiency tests conducted at Shelton Road (RM 28) between May 28 and June 10, 2012. 

Figure 1. Daily O. mykiss catch at Shelton Road between October 15, 2011, and June 10, 2012.
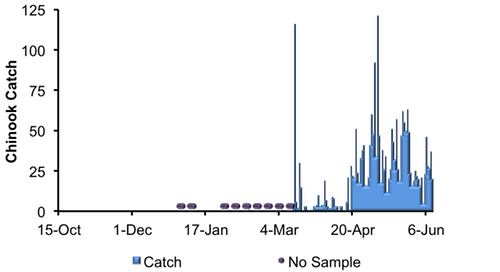
Figure 2. Daily Chinook salmon catch at Shelton Road between October 15, 2011, and June 10, 2012.
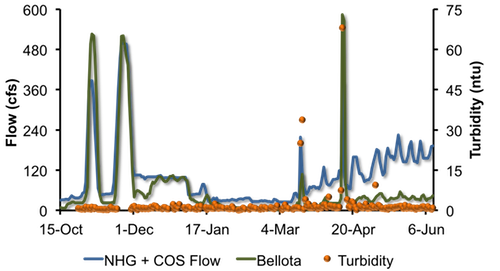
Figure 3. Daily Calaveras River flows recorded at New Hogan Dam and Cosgrove Creek combined (NHG + COS) and at Bellota (MRS) and turbidity recorded at the trap between October 15, 2011, and June 10, 2012.
|
2011/12 Stanislaus River Juvenile Migration Monitoring
 The Stanislaus River rotary screw trap at Oakdale (RM 40) sampled continuously between May 28 and June 10. A total of 806 Chinook salmon were captured, increasing the season total to 25,900. Daily catch ranged between 14 and 211 Chinook salmon (Figure 4). Most of the measured Chinook salmon measured were smolts (n=406), but one parr was also observed. Average forklengths and weights of all measured Chinook salmon are provided in Table 3. The Stanislaus River rotary screw trap at Oakdale (RM 40) sampled continuously between May 28 and June 10. A total of 806 Chinook salmon were captured, increasing the season total to 25,900. Daily catch ranged between 14 and 211 Chinook salmon (Figure 4). Most of the measured Chinook salmon measured were smolts (n=406), but one parr was also observed. Average forklengths and weights of all measured Chinook salmon are provided in Table 3.
A total of 35 O. mykiss were captured during the reporting period, increasing the season total to 82.
Table 3. Biosampling data for salmonids captured and measured at Oakdale (RM 40) between May 28 and June 10, 2012.
 No trap efficiency experiments were conducted during the reporting period. Daily average flows at Goodwin Dam (GDW) decreased from 906 cfs to 605 cfs, and at Ripon (RIP) ranged from 1,041 cfs to 649 cfs. Instantaneous water temperatures taken at the trap ranged from 53.0ºF to 57.0ºF, and turbidity ranged from 0.74 NTU to 4.05 NTU. 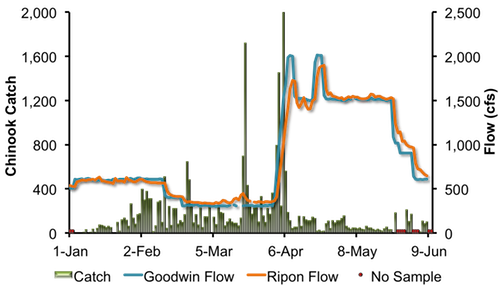
Figure 4. Daily Chinook salmon catch at Oakdale (RM 40) and daily average Stanislaus River flows at Goodwin Dam (GDW) and Ripon (RIP) between January 1, 2012, and June 10, 2012.
At time of this report, information from monitoring at Caswell State Park (RM 8) between May 28 and June 10 is not available.
|
2012 Tuolumne River Juvenile Migration Monitoring
The Tuolumne River rotary screw trap at Waterford (RM 30) operated continuously between May 28 and June 10. A total of 22 juvenile Chinook salmon were captured, increasing the season total to 3,625. Daily catch ranged between 0 and 7 Chinook (Figure 5). Average forklengths and weights of all measured Chinook salmon are provided in Table 4. All of the Chinook salmon measured were smolt (n=22).
One O. mykiss was captured during the reporting period.
Table 4. Biosampling data for salmonids captured and measured at Waterford (RM 30) between May 28 and June 10, 2012. Parentheses indicate range.
No trap efficiency experiments were conducted during the reporting period.
Daily average flows at La Grange (LGN) decreased from 792 cfs to 93 cfs. Instantaneous water temperatures taken at the trap ranged from 60.6ºF to 75.0ºF, and turbidity ranged from 0.77 NTU to 2.01 NTU.
Figure 5. Daily Chinook salmon catch at Waterford (RM 30) and daily average Tuolumne River flows at La Grange (LGN) and between December 1, 2011, and June 10, 2012.
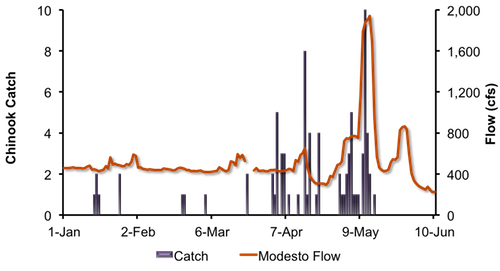
The Tuolumne River rotary screw traps at Grayson (RM 5) operated continuously between May 28 and June 10. No Chinook salmon were captured during the reporting period. Season total remains at 82.
No O. mykiss have been captured this season.
No trap efficiency experiments were conducted.
Daily average flow at Modesto (MOD) decreased from 864 cfs to 225 cfs (Figure 6). Instantaneous water temperatures taken at the trap ranged from 66.0ºF to 78.2ºF, and turbidity ranged from 1.72 NTU to 5.12 NTU.
Figure 6. Daily Chinook salmon catch at Grayson and Tuolumne River flow recorded at Modesto (MOD) between January 1 and June 10, 2012.
|
2011/12 Mokelumne River Juvenile Migration Monitoring
The Mokelumne River rotary screw trap at Vino Farms (RM 54) sampled intermittently between May 28 and June 10. A total of 11 juvenile Chinook salmon were captured, bringing the season total to 12,440. Daily catch ranged between 0 and 5 Chinook (Figure 7).
Four O. mykiss were captured, increasing the season total to 54.
Daily average flows from Camanche Reservoir (CMN) decreased from 371 cfs to 202 cfs. Instantaneous water temperatures ranged between 55.6°F and 60.3°F, and instantaneous turbidity ranged between 1.66 NTU and 2.98 NTU.
 Figure 7. Daily juvenile Chinook catch at Vino Farms (RM 54) and daily averageMokelumne River flows at Camanche Reservoir (CMN) between December 1, 2011, and June 10, 2012. The Mokelumne River Bypass trap (RM 38) sampled intermittently between May 28 and June 10. A total of 1,288 juvenile Chinook salmon were captured during the reporting period, increasing the season total to 7,177.
A total of 37 O. mykiss were captured during the reporting period, increasing the season total to 78. Daily average flows recorded at Woodbridge (WBR) decreased from 142 cfs to 46 cfs (Figure 8). Instantaneous water temperatures ranged between 64.0°F and 69.8°F, and turbidity ranged between 2.27 NTU and 2.68 NTU.
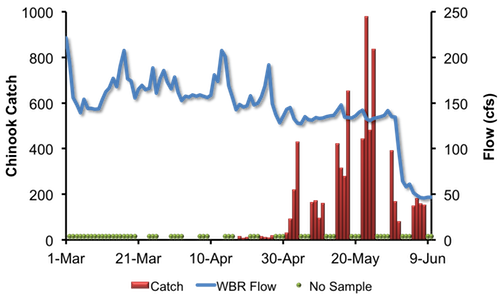
Figure 8. Daily juvenile Chinook catch at the Bypass trap (RM 38) and daily average Mokelumne River flows at Woodbridge (WBR), between March 1, 2012, and June 10, 2012.
|
2012 San Joaquin River Juvenile Migration Monitoring
Kodiak trawling conducted by the California Department of Fish and Game on the San Joaquin River near Mossdale (i.e. the Mossdale Trawl) continued during the reporting period. Ten days (ten tows per day) of trawling were conducted between May 28 and June 10. A total of 332 juvenile Chinook salmon were captured, increasing the season total to 3,208. Catch ranged between 3 and 126 Chinook per 10 tows (Figure 9).
No O. mykiss were captured during the reporting period. Season total remains at 17.
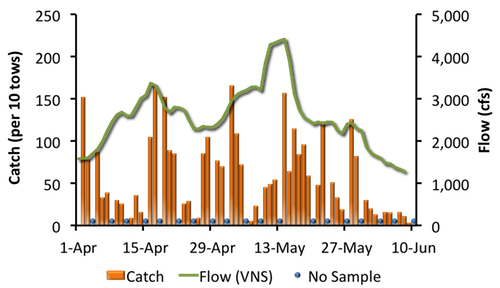
Figure 9. Chinook salmon catch (per 10 tows) at the Mossdale Trawl and San Joaquin River flow recorded by Vernalis (VNS), 2012.
|
2011 Tuolumne River Weir Adult Migration Monitoring
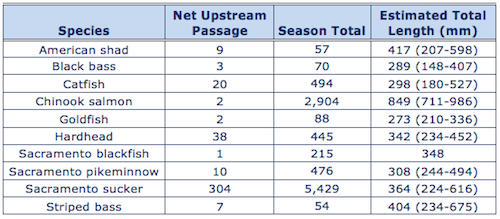
The Tuolumne River Weir and Vaki Riverwatcher (RM 22) continued during the reporting period. A total of 2 Chinook salmon were detected passing upstream of the weir, increasing the season total to 2,904.
 No O. mykiss were detected passing upstream of the weir during the reporting period. The season total remains at 16 (11 naturally spawned, 4 hatchery origin, and one O. mykiss that the adipose fin could not be positively identified for presence/absence). No O. mykiss were detected passing upstream of the weir during the reporting period. The season total remains at 16 (11 naturally spawned, 4 hatchery origin, and one O. mykiss that the adipose fin could not be positively identified for presence/absence).
Other fish passing upstream of the weir included 38 Hardhead and 304 Sacramento suckers (Table 5).
Daily average flows in the Tuolumne River decreased from 792 cfs to 93 cfs at La Grange (LGN; RM 50) and from 864 cfs to 225 cfs at Modesto (MOD; RM 17). Note: flows downstream of La Grange may be higher than dam releases due to accretion and Dry Creek inflows (Figure 10). Instantaneous water temperatures measured at the weir ranged from 63.3˚F and 76.1˚F and daily average water temperatures at Modesto ranged from 63.0˚F and 74.3˚F (Figure 11). Instantaneous turbidity at the weir ranged between 0.75 NTU and 2.88 NTU (Figure 12), and dissolved oxygen ranged between 8.17 mg/L and 11.04 mg/L (Figure 13).
Table 5. Net passage counts for all species between May 28 and June 10, 2012 at the Tuolumne River (RM 22).
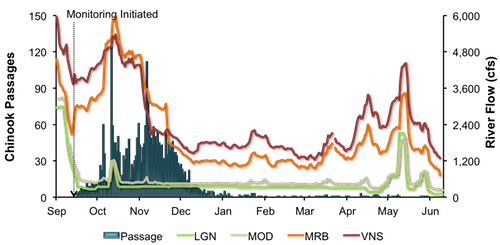
Figure 10. Daily upstream Chinook passage at the Tuolumne River weir in relation to daily average flows (cfs) recorded in the Tuolumne River at La Grange (LGN) and Modesto (MOD), and in the San Joaquin River at Maze Road Bridge (MRB) and Vernalis (VNS), September 1, 2011 and June 10, 2012.
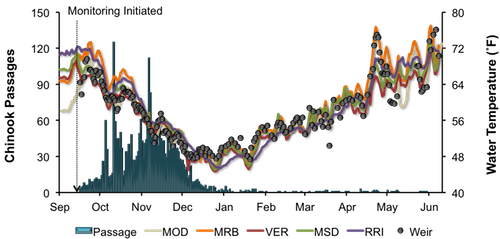
Figure 11. Daily upstream Chinook passage at the Tuolumne River weir in relation to instantaneous water temperature recorded at the weir, and daily average water temperature recorded in the Tuolumne River at Modesto (MOD) and in the San Joaquin River at Maze Road Bridge (MRB), Vernalis (VER), Mossdale (MSD) and Rough & Ready (RRI), September 1, 2011 and June 10, 2012.
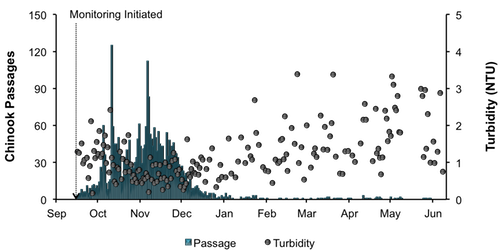
Figure 12. Daily upstream Chinook passage at the Tuolumne River weir in relation to instantaneous turbidity recorded at the weir, September 1, 2011 and June 10, 2012.
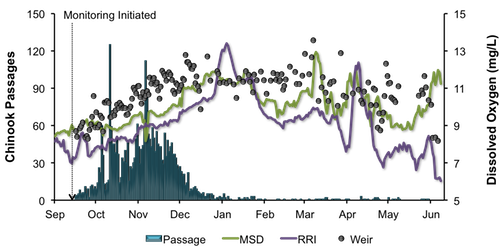
Figure 13. Daily upstream Chinook passage at the Tuolumne River weir in relation to instantaneous dissolved oxygen recorded at the weir, and daily average dissolved oxygen recorded in the San Joaquin River at Mossdale (MSD) and Rough & Ready (RRI), September 1, 2011 and June 10, 2012.
|
San Joaquin River Conditions
During the reporting period, flow in the San Joaquin River at Vernalis decreased from 2,440 cfs to 1,286 cfs (Figure 14). Daily average water temperature in the San Joaquin River ranged from 65.5°F to 71.6°F at Vernalis, from 66.7°F to 73.7°F at Mossdale, and from 67.6°F to 72.2°F at Rough 'n Ready Island (Figure 15). Daily average dissolved oxygen (DO) in the San Joaquin River fluctuated from 9.8 mg/L to 12.0 mg/L at Mossdale, and from 6.0 mg/L to 8.4 mg/L in the deep-water ship channel (measured at Rough 'n Ready Island; Figure 16).
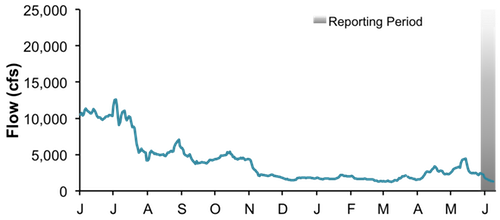
Figure 14. San Joaquin River flows at Vernalis between June 1, 2011, and June 10, 2012.
Figure 15. San Joaquin River daily average water temperature at Vernalis, Mossdale, and Rough 'n Ready between June 1, 2011, and June 10, 2012.
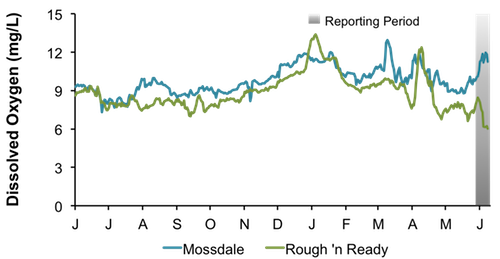
Figure 16. San Joaquin River daily average dissolved oxygen at Mossdale and Rough 'n Ready between June 1, 2011, and June 10, 2012.
|
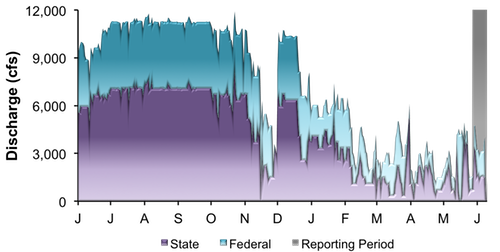
Delta ExportsMean daily pumping at the C.W. Jones Pumping Plant (federal pumps previously known as Tracy Pumping Plant) ranged from 813 cfs to 2,470 cfs (Figure 17). Mean daily pumping at the Harvey O. Banks Pumping Plant (state pumps) fluctuated between 734 cfs to 3,360 cfs. Combined total exports (state and federal pumps) fluctuated during this reporting period, ranging from 1,547 cfs to 4,759 cfs.
Figure 17. Daily exports at the state and federal pumping stations between June 1, 2011, and June 10, 2012.
|
|
|
|
|
|
|