| Volume 2012, Issue 18 | June 5, 2012 |
|

National Conference on Engineering & Ecohydrology for Fish Passage:
June 5-7
PFMC Council Meeting:
June 21-26
Joint Meeting of Ichthyologists & Herpetologists:
August 8-14
|
|

|
Key Highlights
May 14, 2012 - May 27, 2012
Calaveras River Juvenile Migration Monitoring continued at Shelton Road (RM 28) and a total of 65 O. mykiss were captured, increasing the season total to 711. A total of 604 Chinook salmon were also captured, bringing the season total to 1,837.
Stanislaus River Juvenile Migration Monitoring continued at Oakdale (RM 40) and a total of 562 Chinook salmon were captured, increasing the season total to 25,094. A total of 20 O. mykiss were captured, increasing the season total to 47. Monitoring at Caswell State Park (RM 8) continued and a total of 271 Chinook salmon were captured, increasing the season total to 951.
Tuolumne River Juvenile Migration Monitoring continued at Waterford (RM 30) and a total of 52 Chinook salmon were captured, increasing the season total to 3,603. Monitoring at Grayson (RM 5) also continued and one Chinook salmon was captured, increasing the season total to 82. No O. mykiss have been captured this season at Waterford or Grayson.
Mokelumne River Juvenile Migration Monitoring continued at Vino Farms (RM 54) and a total of 30 Chinook salmon were captured, increasing the season total to 12,429. Six O. mykiss were captured, increasing the season total to 50. Monitoring at the Bypass trap (RM 38) continued and a total of 4,416 Chinook salmon were captured, increasing the season total to 5,889. A total of 14 O. mykiss were captured, increasing the season total to 41. Monitoring at Golf (RM 38) also continued and a total of 101 Chinook salmon were captured during the reporting period, increasing the season total to 1,160. One O. mykiss was captured, increasing the season total to 148.
San Joaquin River Juvenile Migration Monitoring. The California Department of Fish and Game (CDFG) continued Kodiak Trawling on the San Joaquin River near Mossdale. A total of 692 Chinook salmon were captured, increasing the season total to 2,876.
Tuolumne River Weir Monitoring (RM 22) resumed on May 21 and a total of 3 Chinook salmon passed upstream through the weir, increasing the season total to 2,896. A total of 26 American shad passed upstream through the weir, increasing the season total to 48.
San Joaquin River Conditions. San Joaquin River flow at Vernalis decreased from 4,418 cfs to 2,180 cfs. Daily average water temperature in the San Joaquin River ranged from 63.3°F to 67.1°F at Vernalis, and from 64.7°F to 68.7°F at Mossdale. Daily average dissolved oxygen (DO) in the San Joaquin River ranged from 8.8 mg/L to 10.1 mg/L at Mossdale, and from 6.6 mg/L to 7.9 mg/L in the deep-water ship channel (measured at Rough 'n Ready Island).
Delta Exports. Combined total exports (state and federal pumps) fluctuated during the reporting period, ranging from 1,476 cfs to 4,943 cfs.
|
|
2011/12 Calaveras River Juvenile Migration Monitoring
The Calaveras River rotary screw trap at Shelton Road (RM 28) sampled continuously between May 14 and May 27. A total of 65 O. mykiss were captured, increasing the  season total to 711. Daily catch ranged from 0 to 9 individuals (Figure 1). Average forklengths and weights for 65 O. mykiss are provided in Table 1. Almost all of the O. mykiss measured were YOY (<100 mm), and were rated as parr (n=46) and silvery parr (n=15), but one Age 1+ (100-299 mm) was also observed and rated as silvery parr. season total to 711. Daily catch ranged from 0 to 9 individuals (Figure 1). Average forklengths and weights for 65 O. mykiss are provided in Table 1. Almost all of the O. mykiss measured were YOY (<100 mm), and were rated as parr (n=46) and silvery parr (n=15), but one Age 1+ (100-299 mm) was also observed and rated as silvery parr.
A total of 604 Chinook salmon were captured during the reporting period, increasing the season total to 1,837.Daily catch ranged between 19 and 63 Chinook (Figure 2). Almost all Chinook salmon measured were smolt (n=602) but parr (n=2) were also observed. Average length and weights are provided in Table 1.
Daily average combined flows from New Hogan Dam (NHG) and Cosgrove Creek (COS) fluctuated between 145 cfs and 225 cfs, and at Bellota (MRS) flows ranged from 33 cfs to 56 cfs (Figure 3). Instantaneous water temperatures recorded at the trap ranged from 53.4ºF to 61.8ºF, and turbidity ranged from 0.66 NTU to 1.90 NTU.
Five trap efficiency experiments were conducted with naturally spawned juvenile Chinook salmon. Preliminary estimates of capture efficiency are provided in Table 2.
Table 1. Biosampling data for salmonids captured at Shelton Road (RM 28) between May 14 and May 27, 2012. Parenthesis indicates range.
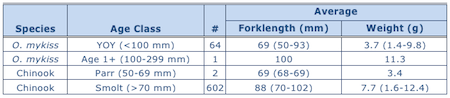 Table 2. Trap efficiency tests conducted at Shelton Road (RM 28) between May 14 and May 27, 2012. 
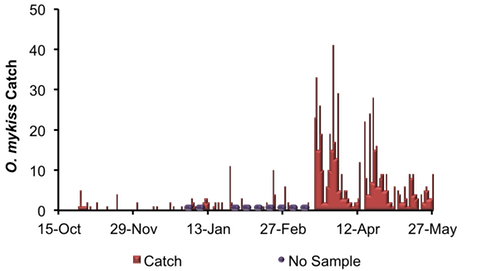
Figure 1. Daily O. mykiss catch at Shelton Road between October 15, 2011, and May 27, 2012.

Figure 2. Daily Chinook salmon catch at Shelton Road between October 15, 2011, and May 27, 2012.
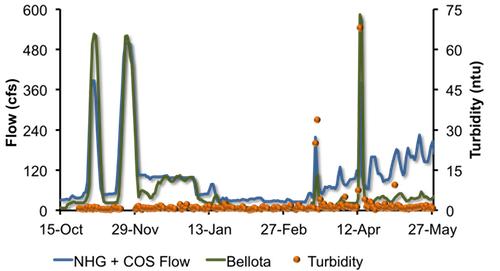
Figure 3. Daily Calaveras River flows recorded at New Hogan Dam and Cosgrove Creek combined (NHG + COS) and at Bellota (MRS) and turbidity recorded at the trap between October 15, 2011, and May 27, 2012.
|
2011/12 Stanislaus River Juvenile Migration Monitoring
 The Stanislaus River rotary screw trap at Oakdale (RM 40) sampled continuously between May 14 and May 27. A total of 562 Chinook salmon were captured, increasing the season total to 25,094. Daily catch ranged between 6 and 186 Chinook (Figure 4). Most of the Chinook salmon measured were smolt (n=432), but parr (n=35) and fry (n=1) were also observed. Average lengths and weights of all measured Chinook salmon are provided in Table 3. The Stanislaus River rotary screw trap at Oakdale (RM 40) sampled continuously between May 14 and May 27. A total of 562 Chinook salmon were captured, increasing the season total to 25,094. Daily catch ranged between 6 and 186 Chinook (Figure 4). Most of the Chinook salmon measured were smolt (n=432), but parr (n=35) and fry (n=1) were also observed. Average lengths and weights of all measured Chinook salmon are provided in Table 3.
A total of 20 O. mykiss were captured during the reporting period, increasing the season total to 47.
Table 3. Biosampling data for salmonids captured and measured at Oakdale (RM 40) between May 14 and May 27, 2012.
 No trap efficiency experiments were conducted during the reporting period. Daily average flows at Goodwin Dam (GDW) decreased from 1,528 cfs to 905 cfs, and at Ripon (RIP) ranged from 1,575 cfs to 1,137 cfs. Instantaneous water temperatures taken at the trap ranged from 52.5ºF to 55.5ºF, and turbidity ranged from 0.58 NTU to 1.62 NTU. 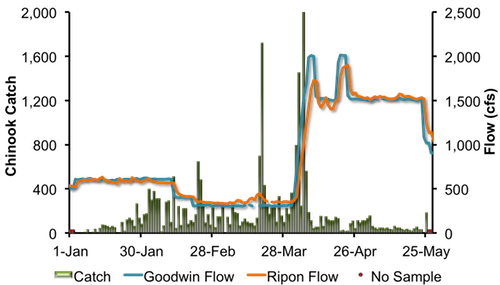
Figure 4. Daily Chinook salmon catch at Oakdale (RM 40) and daily average Stanislaus River flows at Goodwin Dam (GDW) and Ripon (RIP) between January 1, 2012, and May 27, 2012.
The Stanislaus River rotary screw trap at Caswell State Park (RM 8) sampled continuously and a total of 271 juvenile Chinook salmon were captured, increasing the season total to 951.
Instantaneous temperature recorded at the trap ranged from 55.4°F and 60.3°F, and turbidity ranged from 2.01 NTU to 4.88 NTU. Daily average flow at Ripon (RIP) decreased from to 1,575 cfs to 1,137 cfs.
|
2012 Tuolumne River Juvenile Migration Monitoring
 The Tuolumne River rotary screw trap at Waterford (RM 30) operated continuously between May 14 and May 27. A total of 52 juvenile Chinook salmon were captured, increasing the season total to 3,603. Daily catch ranged between 0 and 13 Chinook (Figure 5). Average lengths and weights of all measured Chinook salmon are provided in Table 4. All of the Chinook salmon measured were smolt (n=52). The Tuolumne River rotary screw trap at Waterford (RM 30) operated continuously between May 14 and May 27. A total of 52 juvenile Chinook salmon were captured, increasing the season total to 3,603. Daily catch ranged between 0 and 13 Chinook (Figure 5). Average lengths and weights of all measured Chinook salmon are provided in Table 4. All of the Chinook salmon measured were smolt (n=52).
No O. mykiss have been captured this season..
Table 4. Biosampling data for Chinook salmon captured and measured at Waterford (RM 30) between May 14 and May 27, 2012. Parentheses indicate range.
No trap efficiency experiments were conducted during the reporting period.
Daily average flows at La Grange (LGN) ranged from 267 cfs to 870 cfs. Instantaneous water temperatures taken at the trap ranged from 58.8ºF to 67.8ºF, and turbidity ranged from 0.79 NTU to 3.16 NTU. Figure 5. Daily Chinook salmon catch at Waterford (RM 30) and daily average Tuolumne River flows at La Grange (LGN) and between December 1, 2011, and May 27, 2012. The Tuolumne River rotary screw traps at Grayson (RM 5) operated continuously between May 14 and May 27. One Chinook salmon was captured during the reporting period, increasing the season total to 82. Daily catch ranged between 0 and 1 Chinook (Figure 6). Length and weight of the Chinook salmon smolt is provided in Table 5.
No O. mykiss have been captured this season. Table 5. Biosampling data for Chinook salmon captured and measured at Grayson (RM 5) between May 14 and May 27, 2012. Parentheses indicate range.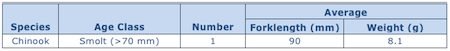
No trap efficiency experiments were conducted. Daily average flow at Modesto (MOD) ranged from 427 cfs to 1,690 cfs. Instantaneous water temperatures taken at the trap ranged from 63.5ºF to 72.5ºF, and turbidity ranged from 0.79 NTU to 3.16 NTU.
Figure 6. Daily Chinook salmon catch at Grayson and Tuolumne River flow recorded at Modesto (MOD) between January 1 and May 27, 2012.
|
2011/12 Mokelumne River Juvenile Migration Monitoring
The Mokelumne River rotary screw trap at Vino Farms (RM 54) sampled intermittently between May 14 and May 27. A total of 30 juvenile Chinook salmon were captured, bringing the season total to 12,429. Daily catch ranged between 2 and 8 Chinook (Figure 7).
Six O. mykiss were captured, increasing the season total to 50.
Daily average flows from Camanche Reservoir (CMN) were stable, ranging from 341 cfs to 360 cfs. Instantaneous water temperatures ranged between 55.4°F and 60.1°F, and instantaneous turbidity ranged between 2.29 NTU and 4.02 NTU.
 Figure 7. Daily juvenile Chinook catch at Vino Farms (RM 54) and daily average Mokelumne River flows at Camanche Reservoir (CMN) between December 1, 2011, and May 27, 2012.
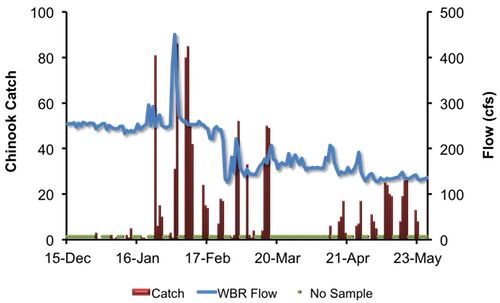
The Mokelumne River Bypass trap (RM 38) sampled intermittently between May 14 and May 27. A total of 4,416 juvenile Chinook salmon were captured during the reporting period, increasing the season total to 5,889.
A total of 14 O. mykiss were captured during the reporting period, increasing the season total to 41.
Daily average flows recorded at Woodbridge (WBR) ranged from 131 cfs to 148 cfs (Figure 8). Instantaneous water temperatures ranged between 65.1°F and 66.9°F, and turbidity ranged between 2.05 NTU and 3.63 NTU. 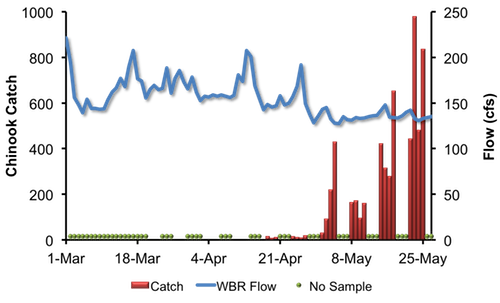
Figure 8. Daily juvenile Chinook catch at the Bypass trap (RM 38) and daily average Mokelumne River flows at Woodbridge (WBR), between March 1, 2012, and May 27, 2012.
The Mokelumne River rotary screw trap at Golf (RM 38) sampled intermittently between May 14 and May 27. A total of 101 juvenile Chinook salmon were captured, increasing the season total of 1,160 (Figure 9).
One O. mykiss was captured during the reporting period, increasing the season total to 148. (Note: 135 were identified as hatchery origin).
Figure 9. Daily juvenile Chinook catch at the rotary screw trap at Golf (RM 38) and daily average Mokelumne River flows at Woodbridge (WBR), between December 15, 2011, and May 27, 2012.
|
2012 San Joaquin River Juvenile Migration Monitoring
Kodiak trawling conducted by the California Department of Fish and Game on the San Joaquin River near Mossdale (i.e. the Mossdale Trawl) continued during the reporting period. Eleven days (ten tows per day) of trawling were conducted between April 30 and May 13. A total of 692 juvenile Chinook salmon were captured, increasing the season total to 2,876. Catch ranged between 19 and 123 Chinook per 10 tows (Figure 10).Two O. mykiss were captured during the reporting period, increasing the season total to 17.
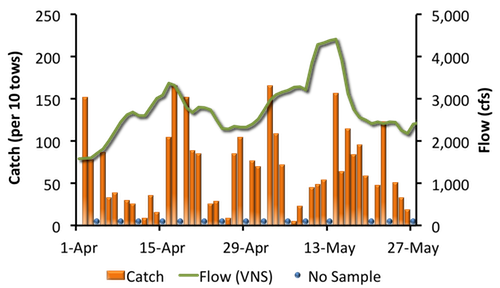
Figure 10. Chinook salmon catch (per 10 tows) at the Mossdale Trawl and San Joaquin River flow recorded by Vernalis (VNS), 2012.
|
2011 Tuolumne River Weir Adult Migration Monitoring
The Tuolumne River Weir and Vaki Riverwatcher (RM 22) monitoring resumed on May 21 after being temporarily suspended for 12 days due to increased flows. A total of 3 Chinook salmon were detected as they passed upstream of the weir, increasing the season total to 2,896. Daily passage ranged between zero and one Chinook salmon.
No O. mykiss were detected passing upstream of the weir during the reporting period. The season total remains at 16 (11 naturally spawned, 4 hatchery origin, and one O. mykiss that the adipose fin could not be positively identified for presence/absence).
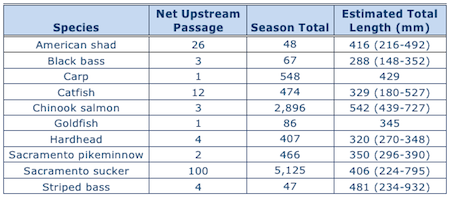
Other fish passing upstream of the weir included 26 American shad and 100 Sacramento suckers (Table 6).
Daily average flows in the Tuolumne River ranged from 267 cfs to 870 cfs at La Grange (LGN; RM 50) and from 427 cfs to 1,690 cfs at Modesto (MOD; RM 17). Note: flows downstream of La Grange may be higher than dam releases due to accretion and Dry Creek inflows (Figure 11). Instantaneous water temperatures measured at the weir ranged from 62.4˚F and 68.1˚F and daily average water temperatures at Modesto ranged from 59.7˚F and 72.0˚F (Figure 12). Instantaneous turbidity at the weir ranged between 1.15 NTU and 2.99 NTU (Figure 13), and dissolved oxygen ranged between 10.60 mg/L and 11.64 mg/L (Figure 14).
Table 6. Net passage counts for all species between May 14 and May 27, 2012 at the Tuolumne River (RM 22).
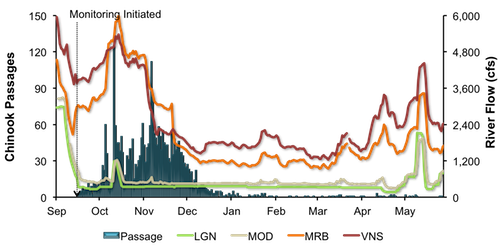
Figure 11. Daily upstream Chinook passage at the Tuolumne River weir in relation to daily average flows (cfs) recorded in the Tuolumne River at La Grange (LGN) and Modesto (MOD), and in the San Joaquin River at Maze Road Bridge (MRB) and Vernalis (VNS), September 1, 2011 and May 27, 2012.
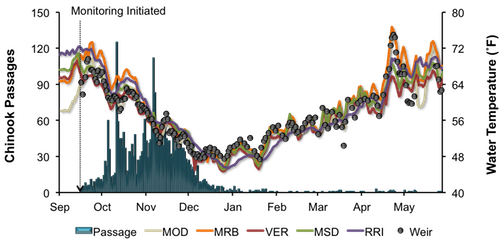
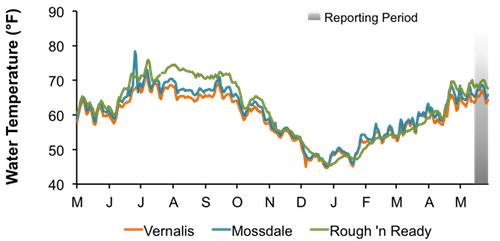
Figure 12. Daily upstream Chinook passage at the Tuolumne River weir in relation to instantaneous water temperature recorded at the weir, and daily average water temperature recorded in the Tuolumne River at Modesto (MOD) and in the San Joaquin River at Maze Road Bridge (MRB), Vernalis (VER), Mossdale (MSD) and Rough & Ready (RRI), September 1, 2011 and May 27, 2012.
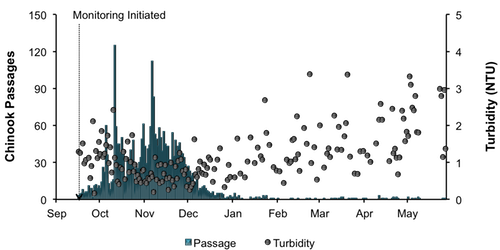
Figure 13. Daily upstream Chinook passage at the Tuolumne River weir in relation to instantaneous turbidity recorded at the weir, September 1, 2011 and May 27, 2012.
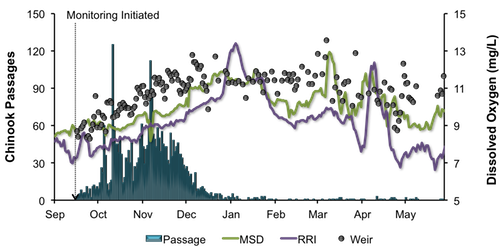
Figure 14. Daily upstream Chinook passage at the Tuolumne River weir in relation to instantaneous dissolved oxygen recorded at the weir, and daily average dissolved oxygen recorded in the San Joaquin River at Mossdale (MSD) and Rough & Ready (RRI), September 1, 2011 and May 27, 2012.
|
San Joaquin River Conditions
During the reporting period, flow in the San Joaquin River at Vernalis decreased from 4,418 cfs to 2,180 cfs (Figure 15). Daily average water temperature in the San Joaquin River ranged from 63.3°F to 67.1°F at Vernalis, from 64.7°F to 68.7°F at Mossdale, and from 67.7°F to 70.1°F at Rough 'n Ready Island (Figure 16). Daily average dissolved oxygen (DO) in the San Joaquin River fluctuated from 8.8 mg/L to 10.1 mg/L at Mossdale, and from 6.6 mg/L to 7.9 mg/L in the deep-water ship channel (measured at Rough 'n Ready Island; Figure 17).

Figure 15. San Joaquin River flows at Vernalis between May 1, 2011, and May 27, 2012.
Figure 16. San Joaquin River daily average water temperature at Vernalis, Mossdale, and Rough 'n Ready between May 1, 2011, and May 27, 2012.
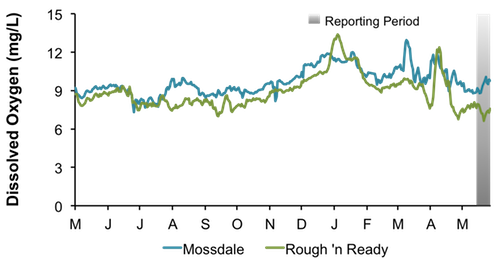
Figure 17. San Joaquin River daily average dissolved oxygen at Mossdale and Rough 'n Ready between May 1, 2011, and May 27, 2012.
|
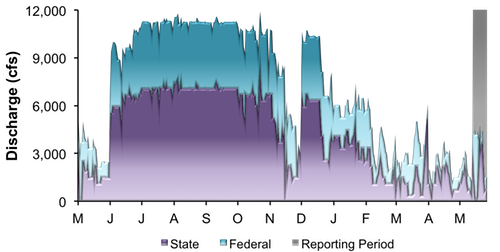
Delta ExportsMean daily pumping at the C.W. Jones Pumping Plant (federal pumps previously known as Tracy Pumping Plant) ranged from 812 cfs to 4,213 cfs (Figure 18). Mean daily pumping at the Harvey O. Banks Pumping Plant (state pumps) fluctuated between 0 cfs to 4,127 cfs. Combined total exports (state and federal pumps) fluctuated during this reporting period, ranging from 1,476 cfs to 4,943 cfs.
Figure 18. Daily exports at the state and federal pumping stations between May 1, 2011, and May 27, 2012.
|
|
|
|
|
|
|