| Volume 2012, Issue 15 | April 25, 2012 |
|

Pick and Gather at Riverdance Farms and Merced River Fair:
June 2-3
National Conference on Engineering & Ecohydrology for Fish Passage:
June 5-7
|
|

|
Key Highlights
April 2, 2012 - April 15, 2012
Calaveras River Juvenile Migration Monitoring continued at Shelton Road (RM 28) during the reporting period.A total of 49 O. mykiss were captured, increasing the season total to 437. A total of 62 Chinook salmon were also captured, bringing the season total to 276.
Stanislaus River Juvenile Migration Monitoring continued at Oakdale (RM 40) during the reporting period. A total of 6,348 Chinook salmon were captured, increasing the season total to 22,429. Two O. mykiss were captured, increasing the season total to 21. Monitoring at Caswell State Park (RM 8) continued during the reporting period. A total of 138 Chinook salmon were captured, increasing the season total to 295.
Tuolumne River Juvenile Migration Monitoring continued at Waterford (RM 30) during the reporting period. A total of 343 Chinook salmon were captured, increasing the season total to 3,195. Monitoring at Grayson (RM 5) continued during the reporting period. A total of 22 Chinook salmon were captured, increasing the season total to 35. No O. mykiss have been captured this season at Waterford or Grayson.
Mokelumne River Juvenile Migration Monitoring continued at Vino Farms (RM 54) during the reporting period. A total of 61 Chinook salmon were captured, increasing the season total to 12,348. Eight O. mykiss were captured, increasing the season total to 34. Monitoring at the Bypass trap (RM 38) continued during the reporting period and two Chinook salmon were captured. Monitoring at Golf (RM 38) continued on April 13. A total of 6 Chinook salmon were captured during the reporting period, increasing the season total to 879.
San Joaquin River Juvenile Migration Monitoring. On April 2 the California Department of Fish and Game (CDFG) initiated Kodiak Trawling on the San Joaquin River near Mossdale.
Stanislaus River Weir Monitoring ended during the reporting period because flows were increased (>1,500 cfs) to meet the requirements of the biological opinion. No Chinook salmon passed upstream through the weir during the reporting period. The season total remains at 818. During the reporting period one O. mykiss passed upstream through the weir, increasing the season total to 82.
Tuolumne River Weir Monitoring continued during the reporting period. A total of six Chinook salmon passed upstream through the weir, increasing the season total to 2,879. No O. mykiss passed upstream through the weir during the reporting period. Season total remains at 11.
San Joaquin River Conditions. San Joaquin River flow at Vernalis ranged from 1,596 cfs to 3,085 cfs. Daily average water temperature in the San Joaquin River ranged from 57.1°F to 61.4°F at Vernalis, and from 58.3°F to 62.1°F at Mossdale. Daily average dissolved oxygen (DO) in the San Joaquin River ranged from 10.2 mg/L to 11.9 mg/L at Mossdale, and from 7.9 mg/L to 12.4 mg/L in the deep-water ship channel (measured at Rough 'n Ready Island).
Delta Exports. Combined total exports (state and federal pumps) fluctuated during the reporting period, ranging from 1,092 cfs to 3,573 cfs.
|
|
2011/12 Calaveras River Juvenile Migration Monitoring
The Calaveras River rotary screw trap at Shelton Road (RM 28) sampled 12 days  between April 2 and April 15. A total of 49 O. mykiss were captured, increasing the season total to 437. Daily catch ranged from 1 to 12 individuals (Figure 1). Average forklengths and weights for 226 O. mykiss are provided in Table 1. A majority of the O. mykiss measured were YOY (<100 mm), and were rated as fry (n=30) and parr (n=12), but Age 1+ (100-299 mm) were also observed, and were rated as silvery parr (n=3) and smolt (n=2). between April 2 and April 15. A total of 49 O. mykiss were captured, increasing the season total to 437. Daily catch ranged from 1 to 12 individuals (Figure 1). Average forklengths and weights for 226 O. mykiss are provided in Table 1. A majority of the O. mykiss measured were YOY (<100 mm), and were rated as fry (n=30) and parr (n=12), but Age 1+ (100-299 mm) were also observed, and were rated as silvery parr (n=3) and smolt (n=2).
A total of 62 Chinook salmon were captured during the reporting period, increasing the season total to 276.Daily catch ranged between 0 and 19 Chinook (Figure 2). Most of the Chinook salmon measured were parr (n=37) but fry (n=3) and smolt (n=21) were also observed and average forklengths and weights are provided in Table 1.
Daily average combined flows from New Hogan Dam (NHG) and Cosgrove Creek (COS) fluctuated between 75 cfs and 380 cfs, and at Bellota (MRS) flows ranged from 21 cfs to 584 cfs (Figure 3).Instantaneous water temperatures recorded at the trap ranged from 48.9ºF to 55.0ºF, and turbidity ranged from 0.89 NTU to 68.00 NTU.
Table 1. Biosampling data for salmonids captured at Shelton Road (RM 28) between April 2 and April 15, 2012. Parenthesis indicates range.
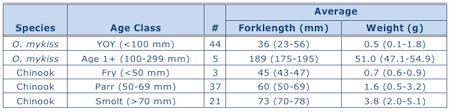
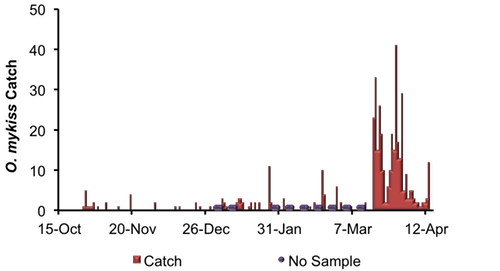
Figure 1. Daily O. mykiss catch at Shelton Road between October 15, 2011, and April 15, 2012.
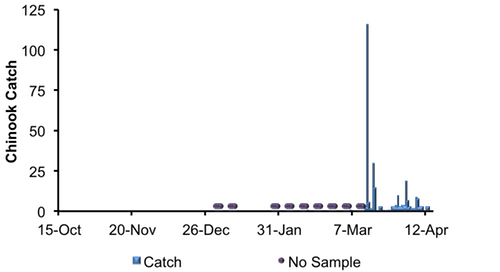
Figure 2. Daily Chinook salmon catch at Shelton Road between October 15, 2011, and April 15, 2012.

Figure 3. Daily Calaveras River flows recorded at New Hogan Dam and Cosgrove Creek combined (NHG + COS) and at Bellota (MRS) and turbidity recorded at the trap between October 15, 2011, and April 15, 2012.
|
2011/12 Stanislaus River Juvenile Migration Monitoring
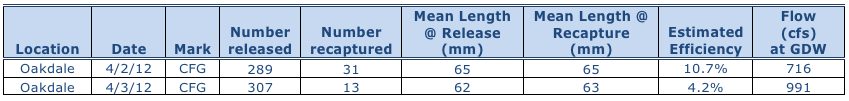
 The Stanislaus River rotary screw trap at Oakdale (RM 40) sampled continuously between April 2 thru April 15. A total of 6,348 Chinook salmon were captured, increasing the season total to 22,429. Daily catch ranged between 45 and 2,322 Chinook (Figure 4). Most of the Chinook salmon measured were parr (n=544), but fry (n=40) and smolt (n=346) were also observed. Average forklengths and weights of all measured Chinook salmon are provided in Table 2. The Stanislaus River rotary screw trap at Oakdale (RM 40) sampled continuously between April 2 thru April 15. A total of 6,348 Chinook salmon were captured, increasing the season total to 22,429. Daily catch ranged between 45 and 2,322 Chinook (Figure 4). Most of the Chinook salmon measured were parr (n=544), but fry (n=40) and smolt (n=346) were also observed. Average forklengths and weights of all measured Chinook salmon are provided in Table 2.
Two O. mykiss was captured during the reporting period, increasing the season total to 21.
Table 2. Biosampling data for salmonids captured and measured at Oakdale (RM 40) between April 2 and April 15, 2012.
 Two trap efficiency experiments were conducted with naturally spawned juvenile Chinook salmon marked caudal fin green (CFG). Preliminary estimates of capture efficiency are provided in Table 3.
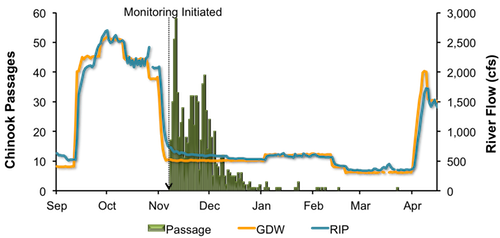
Table 3. Trap efficiency tests conducted at Oakdale (RM 40) between April 2 and April 15, 2012. Daily average flows at Goodwin Dam (GDW) ranged from 716 cfs to 2,013 cfs, and at Ripon (RIP) ranged from 408 cfs to 1,726 cfs. Instantaneous water temperatures taken at the trap ranged from 50.5ºF to 58.1ºF, and turbidity ranged from 1.01 NTU to 3.38 NTU.

Figure 4. Daily Chinook salmon catch at Oakdale (RM 40) and daily average Stanislaus River flows at Goodwin Dam (GDW) and Ripon (RIP) between January 1, 2012, and April 15, 2012.
The Stanislaus River rotary screw trap at Caswell State Park (RM 8) operated continuously between April 2 and April 15. A total of 138 juvenile Chinook salmon were captured during the reporting period, increasing the season total to 295. Daily average flow at Ripon (RIP) ranged from 408 cfs to 1,726 cfs.
|
2012 Tuolumne River Juvenile Migration Monitoring
 The Tuolumne River rotary screw trap at Waterford (RM 30) operated continuously between April 2 thru April 15. A total of 343 juvenile Chinook salmon were captured, increasing the season total to 3,195. Daily catch ranged between 1 and 97 Chinook (Figure 5). Average forklengths and weights of all measured Chinook salmon are provided in Table 4. Most of the Chinook salmon measured were smolt (n=160), but fry (n=2) and parr (n=122) were also observed. The Tuolumne River rotary screw trap at Waterford (RM 30) operated continuously between April 2 thru April 15. A total of 343 juvenile Chinook salmon were captured, increasing the season total to 3,195. Daily catch ranged between 1 and 97 Chinook (Figure 5). Average forklengths and weights of all measured Chinook salmon are provided in Table 4. Most of the Chinook salmon measured were smolt (n=160), but fry (n=2) and parr (n=122) were also observed.
No O. mykiss were captured, and the season total remains at zero.
Table 4. Biosampling data for Chinook salmon captured and measured at Waterford (RM 30) between April 2 and April 15, 2012. Parentheses indicate range.
Two trap efficiency experiments were conducted with naturally spawned juvenile Chinook salmon marked caudal fin orange (CFO). Preliminary estimates of capture efficiency are provided in Table 5.
Table 5. Trap efficiency tests conducted at Waterford (RM 30) between April 2 and April 15, 2012.
Daily average flows at La Grange (LGN) were relatively stable, between 236 cfs and 317 cfs. Instantaneous water temperatures taken at the trap ranged from 54.3ºF to 58.2ºF, and turbidity ranged from 0.45 NTU to 9.48 NTU.
Figure 5. Daily Chinook salmon catch at Waterford (RM 30) and daily average Tuolumne River flows at La Grange (LGN) and Modesto (MOD) between December 1, 2011, and April 15, 2012.
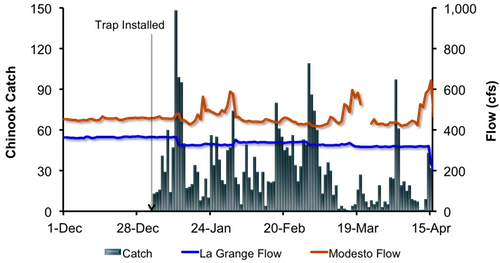
The Tuolumne River rotary screw traps at Grayson (RM 5) operated continuously between April 2 and April 15. A total of 22 Chinook salmon were captured during the reporting period, increasing the season total to 35. Daily catch ranged between 0 and 8 Chinook (Figure 6). Average forklengths and weights of all measured Chinook salmon are provided in Table 6. All Chinook salmon captured were smolt (n=22).
No O. mykiss were captured, and the season total remains at zero.
Table 6. Biosampling data for Chinook salmon captured and measured at Grayson (RM 5) between April 2 and April 15, 2012. Parentheses indicate range.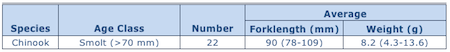
No trap efficiency experiments were conducted. Daily average flow at Modesto (MOD) was stable during the reporting period, ranging between 420 cfs and 643 cfs. Instantaneous water temperatures taken at the trap ranged from 56.8ºF to 63.6ºF, and turbidity ranged from 0.83 NTU to 38.50 NTU.Figure 6. Daily Chinook salmon catch at Grayson and Tuolumne River flow recorded at La Grange (LGN) and Modesto (MOD) between January 1 and April 15, 2012.
|
2011/12 Mokelumne River Juvenile Migration Monitoring
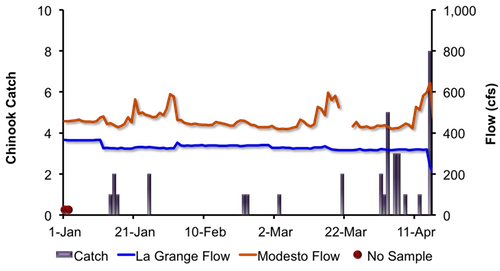
The Mokelumne River rotary screw trap at Vino Farms (RM 54) sampled intermittently between April 2 and April 15. A total of 61 juvenile Chinook salmon were captured, bringing the season total to 12,348. Daily catch ranged between 2 and 15 Chinook (Figure 7).
Eight O. mykiss were captured, increasing the season total to 34.
Daily average flows from Camanche Reservoir (CMN) were stable, ranging from 245 cfs to 254 cfs. Instantaneous water temperatures ranged between 52.2°F and 54.3°F, and instantaneous turbidity ranged between 2.18 NTU and 5.17 NTU.
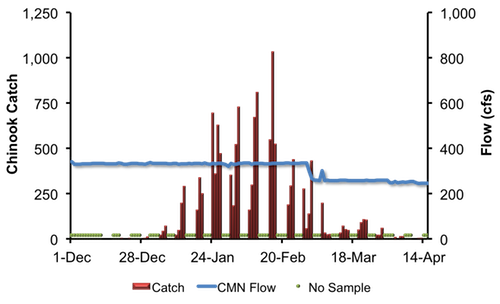 Figure 7. Daily juvenile Chinook catch at Vino Farms (RM 54) and daily average Mokelumne River flows at Camanche Reservoir (CMN) between December 1, 2011, and April 15, 2012. The Mokelumne River Bypass trap (RM 38) sampled intermittently between April 2 and April 15. Two juvenile Chinook salmon were captured during the reporting period. No O. mykiss were captured during the reporting period. Daily average flows recorded at Woodbridge (WBR) ranged from 153 cfs to 207 cfs (Figure 8). Instantaneous water temperatures ranged between 57.4°F and 59.9°F, and turbidity ranged between 1.99 NTU and 3.86 NTU.
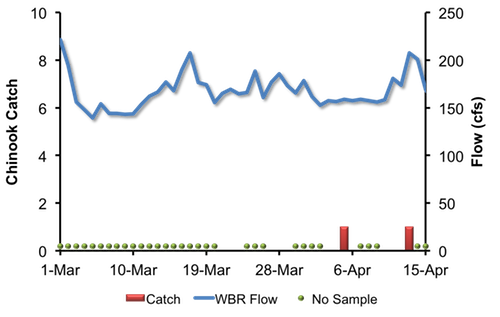
Figure 8. Daily juvenile Chinook catch at the Bypass trap (RM 38) and daily average Mokelumne River flows at Woodbridge (WBR), between March 1, 2012, and April 15, 2012. The Mokelumne River rotary screw trap at Golf (RM 38) began on April 13. A total of 6 juvenile Chinook salmon were captured, increasing the season total of 879 (Figure 9). No O. mykiss were captured during the reporting period. Season total remains at 144. (Note: 135 were identified as hatchery origin).
Figure 9. Daily juvenile Chinook catch at the rotary screw trap at Golf (RM 38) and daily average Mokelumne River flows at Woodbridge (WBR), between December 15, 2011, and April 15, 2012.
|
2012 San Joaquin River Juvenile Migration Monitoring
On April 2 the California Department of Fish and Game initiated Kodiak Trawling on the San Joaquin River near Mossdale (i.e. the Mossdale Trawl). Ten days (ten tows per day) of trawling were conducted between April 2 and April 15. A total of 506 juvenile Chinook salmon were captured. Catch ranged between 9 and 152 Chinook per 10 tows (Figure 10).
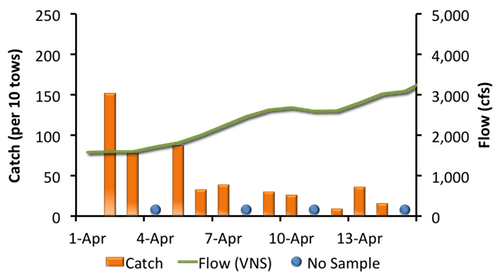
Figure 10. Chinook salmon catch (per 10 tows) at the Mossdale Trawl and San Joaquin River flow recorded by Vernalis (VNS), 2012.
|
2011 Stanislaus River Weir Adult Migration Monitoring
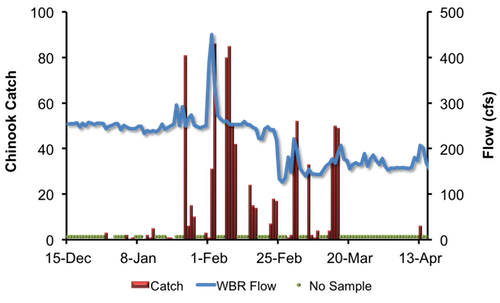
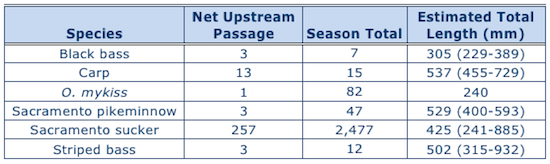
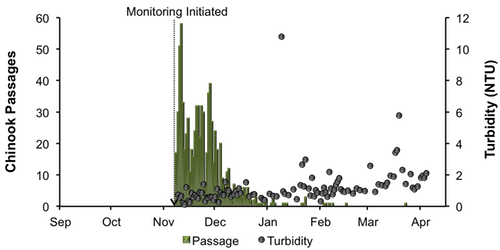
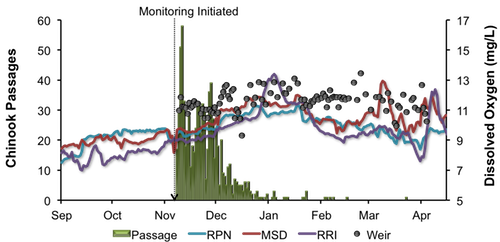
Due to an increase in flow (>1,500 cfs) that exceeds the operational capacity of the weir (ie, ability to remain afloat), the resistance boards and barrels that assist flotation were removed on April 3. The Vaki Riverwatcher detected a total of 818 Chinook salmon passing upstream of the Stanislaus River Weir since November 8. One O. mykiss was detected passing upstream of the weir, increasing the season total to 82. The adipose fins of hatchery origin O. mykiss are clipped before release. The O. mykiss observed during the reporting period was positively identified as naturally spawned origin. The season totals for passage of O. mykiss are 53 hatchery origin, 15 natural spawned origin, and 14 that could not be determined. Other fish passing upstream of the weir included 3 Striped bass and 257 Sacramento suckers (Table 7). Daily average flows in the Stanislaus River at Goodwin Dam (GDW; RM 58) were stable, between 301 cfs and 402 cfs (Figure 11). Flows at Ripon (RIP; RM 15) fluctuated between 344 cfs and 405 cfs. Note: flows downstream of Goodwin Dam may differ from dam releases due to irrigation, precipitation and other factors. Instantaneous water temperature measured at the weir ranged between 53.7˚F and 60.4˚F, and daily average water temperature at Ripon (RPN; RM 15) ranged between 53.0˚F and 61.4˚F (Figure 12). Instantaneous turbidity at the weir ranged between 1.08 NTU and 5.77 NTU (Figure 13). Instantaneous dissolved oxygen at the weir ranged between 10.87 mg/L and 12.66 mg/L, and daily average dissolved oxygen at Ripon (RPN; RM 15) ranged from 8.39 mg/L to 9.70 mg/L (Figure 14). Table 7. Net passage counts for all species between April 2 and April 15, 2012, at the Stanislaus River weir (RM 31). Figure 11. Daily upstream Chinook passage at the Stanislaus River weir in relation to daily average flows (cfs) recorded in the Stanislaus River at Goodwin (GDW) and Ripon (RIP), September 1, 2011 and April 15, 2012. Figure 12. Daily upstream Chinook passage recorded at the Stanislaus River weir in relation to instantaneous water temperature recorded at the weir, and daily average water temperature recorded in the Stanislaus River at Ripon (RPN), and in the San Joaquin River at Vernalis (VER), Mossdale (MSD) and Rough & Ready (RRI), September 1, 2011 and April 15, 2012.
Figure 13. Daily upstream Chinook passage at the Stanislaus River weir in relation to instantaneous turbidity recorded at the weir, September 1, 2011 and April 15, 2012.
Figure 14. Daily upstream Chinook passage at the Stanislaus River weir in relation to instantaneous dissolved oxygen recorded at the weir, and daily average dissolved oxygen recorded in the Stanislaus River at Ripon (RPN), and in the San Joaquin River at Mossdale (MSD) and Rough & Ready (RRI), September 1, 2011 and April 15, 2012.
|
2011 Tuolumne River Weir Adult Migration Monitoring
The Tuolumne River Weir and Vaki Riverwatcher (RM 22) sampled continuously between April 2 and April 15. A total of six Chinook salmon were detected as they passed upstream of the weir, increasing the season total to 2,879. Daily passage ranged between zero and three Chinook salmon.
No O. mykiss were detected passing upstream of the weir during the reporting period. The season total remains at 11.
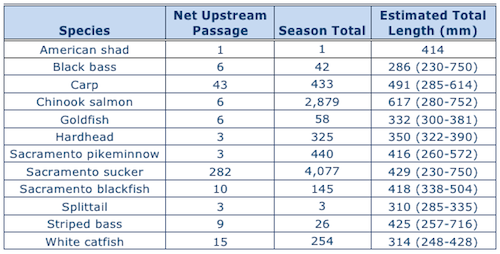
Other fish passing upstream of the weir included 43 carp and 282 Sacramento suckers (Table 8).
Daily average flows in the Tuolumne River ranged from 236 cfs to 320 cfs at La Grange (LGN; RM 50) and from 420 cfs to 643 cfs at Modesto (MOD; RM 17). Note: flows downstream of La Grange may be higher than dam releases due to accretion and Dry Creek inflows (Figure 15). Instantaneous water temperatures measured at the weir ranged from 57.0˚F and 61.5˚F and daily average water temperatures at Modesto ranged from 57.6˚F and 61.3˚F (Figure 16). Instantaneous turbidity at the weir ranged between 1.01 NTU and 2.58 NTU (Figure 17), and dissolved oxygen ranged between 10.20 mg/L and 11.90 mg/L (Figure 18).
Table 8. Net passage counts for all species between April 2 and April 15, 2012 at the Tuolumne River (RM 22).
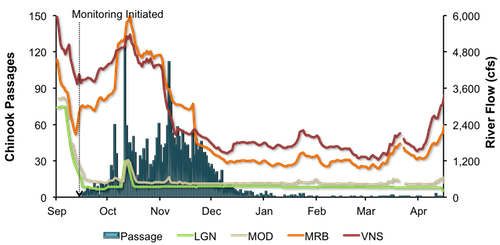
Figure 15. Daily upstream Chinook passage at the Tuolumne River weir in relation to daily average flows (cfs) recorded in the Tuolumne River at La Grange (LGN) and Modesto (MOD), and in the San Joaquin River at Maze Road Bridge (MRB) and Vernalis (VNS), September 1, 2011 and April 15, 2012.
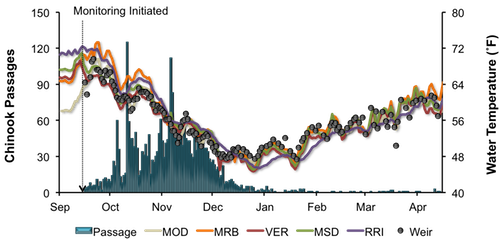
Figure 16. Daily upstream Chinook passage at the Tuolumne River weir in relation to instantaneous water temperature recorded at the weir, and daily average water temperature recorded in the Tuolumne River at Modesto (MOD) and in the San Joaquin River at Maze Road Bridge (MRB), Vernalis (VER), Mossdale (MSD) and Rough & Ready (RRI), September 1, 2011 and April 15, 2012.

Figure 17. Daily upstream Chinook passage at the Tuolumne River weir in relation to instantaneous turbidity recorded at the weir, September 1, 2011 and April 15, 2012.
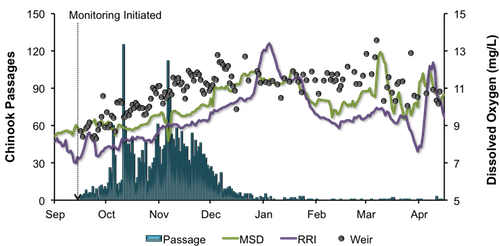
Figure 18. Daily upstream Chinook passage at the Tuolumne River weir in relation to instantaneous dissolved oxygen recorded at the weir, and daily average dissolved oxygen recorded in the San Joaquin River at Mossdale (MSD) and Rough & Ready (RRI), September 1, 2011 and April 15, 2012.
|
San Joaquin River Conditions
During the reporting period, flow in the San Joaquin River at Vernalis ranged from 1,596 cfs to 3,085 cfs (Figure 19). Daily average water temperature in the San Joaquin River ranged from 57.1°F to 61.4°F at Vernalis, from 58.3°F to 62.1°F at Mossdale, and from 58.7°F to 61.1°F at Rough 'n Ready Island (Figure 20). Daily average dissolved oxygen (DO) in the San Joaquin River fluctuated from 10.2 mg/L to 11.9 mg/L at Mossdale, and from 7.9 mg/L to 12.4 mg/L in the deep-water ship channel (measured at Rough 'n Ready Island; Figure 21).
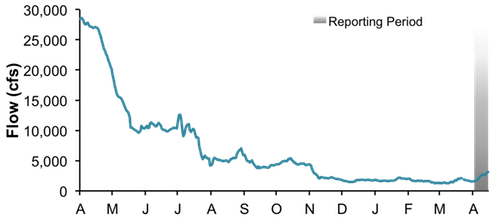
Figure 19. San Joaquin River flow at Vernalis from April 1, 2011, through April 15, 2012.
Figure 20. San Joaquin River daily average water temperature at Vernalis, Mossdale, and Rough 'n Ready from April 1, 2011, through April 15, 2012.
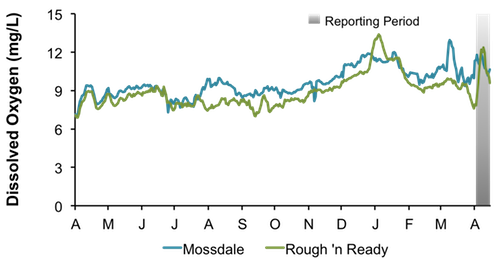
Figure 21. San Joaquin River daily average dissolved oxygen at Mossdale and Rough 'n Ready, from April 1, 2011, through April 15, 2012.
|
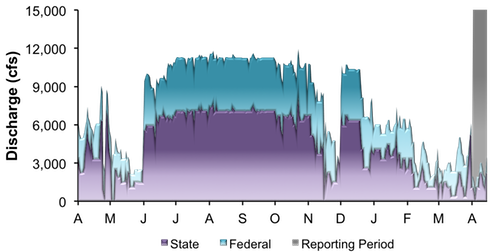
Delta ExportsMean daily pumping at the C.W. Jones Pumping Plant (federal pumps previously known as Tracy Pumping Plant) ranged from 813 cfs to 1,371 cfs (Figure 22). Mean daily pumping at the Harvey O. Banks Pumping Plant (state pumps) ranged from 275 cfs to 2,202 cfs. Combined total exports (state and federal pumps) fluctuated during this reporting period, ranging from 1,092 cfs to 3,573 cfs.
Figure 22. Daily exports at the state and federal pumping stations from April 1, 2011, through April 15, 2012.
|
|
|
|
|
|
|