| Volume 2012, Issue 13 | March 28, 2012 |
|

Cal-Neva AFS Meeting:
March 28-31
Salmonid Restoration Federation Conference:
April 4-7
Pick and Gather at Riverdance Farms and Merced River Fair:
June 2-3
National Conference on Engineering & Ecohydrology for Fish Passage:
June 5-7
|
|
|
Key Highlights
March 5, 2012 - March 18, 2012
Calaveras River Juvenile Migration Monitoring continued at Shelton Road (RM 28) during the reporting period.A total of 59 O. mykiss were captured, increasing the season total to 152. A total of 173 Chinook salmon fry were also captured, bringing the season total to 174.
Stanislaus River Juvenile Migration Monitoring continued at Oakdale (RM 40) during the reporting period. A total of 2,354 Chinook salmon were captured, increasing the season total to 11,214. One O. mykiss was captured, increasing the season total to 18. Information is not available from monitoring at Caswell State Park (RM 8).
Tuolumne River Juvenile Migration Monitoring continued at Waterford (RM 30) during the reporting period. A total of 188 Chinook salmon were captured, increasing the season total to 2,683. Monitoring at Grayson (RM 5) continued during the reporting period. No Chinook salmon were captured during the reporting period. Season total remains at nine. No O. mykiss have been captured this season at Waterford or Grayson.
Mokelumne River Juvenile Migration Monitoring continued at Vino Farms (RM 54) during the reporting period. A total of 495 Chinook salmon were captured, increasing the season total to 11,827. Four O. mykiss were captured, increasing the season total to 16. Monitoring at Golf (RM 38) continued during the reporting period. A total of 177 Chinook salmon were captured, increasing the season total to 873. A total of 115 O. mykiss were captured, increasing the season total to 144, and nearly all (94%) O. mykiss have been hatchery origin.
Stanislaus River Weir Monitoring continued during the reporting period. No Chinook salmon passed upstream through the weir. The season total remains at 817. During the reporting period three O. mykiss passed upstream through the weir, increasing the season total to 78.
Tuolumne River Weir Monitoring continued during the reporting period. A total of 4 Chinook salmon passed upstream through the weir, increasing the season total to 2,851. Two O. mykiss passed upstream through the weir during the reporting period, increasing the season total to 11.
San Joaquin River Conditions. San Joaquin River flow at Vernalis ranged from 1,236 cfs to 2,033 cfs. Daily average water temperature in the San Joaquin River ranged from 54.1°F to 59.2°F at Vernalis, and from 54.9°F to 59.0°F at Mossdale. Daily average dissolved oxygen (DO) in the San Joaquin River ranged from 9.7 mg/L to 12.9 mg/L at Mossdale, and from 9.1 mg/L to 10.0 mg/L in the deep-water ship channel (measured at Rough 'n Ready Island).
Delta Exports. Combined total exports (state and federal pumps) fluctuated during the reporting period, ranging from 1,844 cfs to 3,950 cfs.
|
|
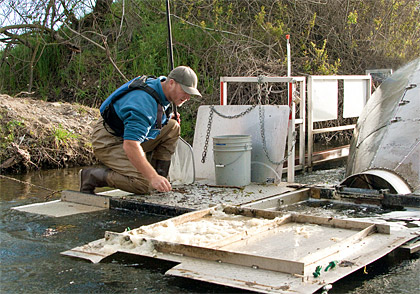
2011/12 Calaveras River Juvenile Migration Monitoring
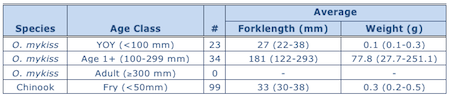
The Calaveras River rotary screw trap at Shelton Road (RM 28) sampled eleven days between March 5 and March 18. A total of 59 O. mykiss were captured, increasing the  season total to 152. Daily catch ranged from 0 to 33 individuals (Figure 1). Average forklengths and weights of the 57 measured O. mykiss are provided in Table 1. A majority of the O. mykiss measured were Age 1+ (100-299 mm), and were rated as silvery parr (n=22) or smolts (n=12), but YOY (<100 mm) were also observed, and were rated as fry (n=23). season total to 152. Daily catch ranged from 0 to 33 individuals (Figure 1). Average forklengths and weights of the 57 measured O. mykiss are provided in Table 1. A majority of the O. mykiss measured were Age 1+ (100-299 mm), and were rated as silvery parr (n=22) or smolts (n=12), but YOY (<100 mm) were also observed, and were rated as fry (n=23). A total of 173 Chinook salmon were captured during the reporting period, increasing the season total to 174.Daily catch ranged between 0 and 116 Chinook (Figure 2). All Chinook salmon measured were fry (n=99) and average forklengths and weights are provided in Table 1. Daily average combined flows from New Hogan Dam (NHG) and Cosgrove Creek (COS) fluctuated between 26 cfs and 218 cfs, and at Bellota (MRS) flows ranged from 0 cfs to 108 cfs (Figure 3). Instantaneous water temperatures recorded at the trap ranged from 48.9ºF to 55.2ºF, and turbidity ranged from 0.29 NTU to 33.70 NTU. Table 1. Biosampling data for salmonids captured at Shelton Road (RM 28) between March 5 and March 18, 2012. Parenthesis indicates range.
 One trap efficiency experiment was conducted with naturally spawned juvenile Chinook salmon marked caudal fin pink (CFP) and one trap efficiency experiment was conducted with naturally spawned juvenile O. mykiss marked caudal fin pink (CFP). Preliminary estimates of capture efficiency are provided in Table 2.
Table 2. Trap efficiency tests conducted at Shelton Road (RM 28) between March 5 and March 18, 2012.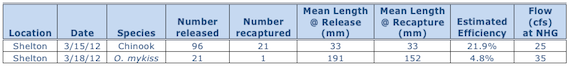 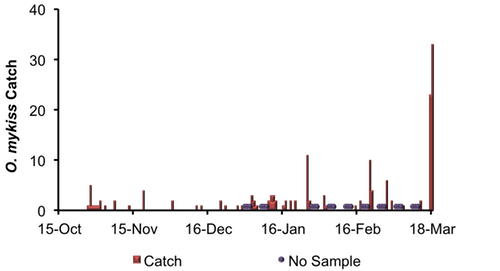
Figure 1. Daily O. mykiss catch at Shelton Road between October 15, 2011, and March 18, 2012.
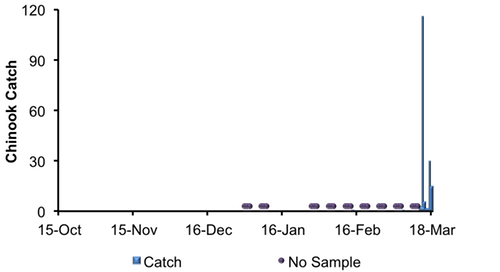
Figure 2. Daily Chinook salmon catch at Shelton Road between October 15, 2011, and March 18, 2012.
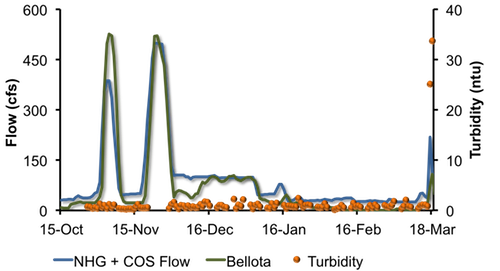
Figure 3. Daily Calaveras River flows recorded at New Hogan Dam and Cosgrove Creek combined (NHG + COS) and at Bellota (MRS) and turbidity recorded at the trap between October 15, 2011, and March 18, 2012.
|
2011/12 Stanislaus River Juvenile Migration Monitoring
 The Stanislaus River rotary screw trap at Oakdale (RM 40) sampled continuously between March 5 and March 18. A total of 2,354 Chinook salmon were captured, increasing the season total to 11,214. Daily catch ranged between 68 and 701 Chinook (Figure 4). Most of the Chinook salmon measured were parr (n=552), but fry (n=268) and smolt (n=61) were also observed. Average forklengths and weights of all measured Chinook salmon are provided in Table 3. The Stanislaus River rotary screw trap at Oakdale (RM 40) sampled continuously between March 5 and March 18. A total of 2,354 Chinook salmon were captured, increasing the season total to 11,214. Daily catch ranged between 68 and 701 Chinook (Figure 4). Most of the Chinook salmon measured were parr (n=552), but fry (n=268) and smolt (n=61) were also observed. Average forklengths and weights of all measured Chinook salmon are provided in Table 3.
One O. mykiss was captured during the reporting period, increasing the season total to 18.
Table 3. Biosampling data for salmonids captured and measured at Oakdale (RM 40) between March 5 and March 18, 2012.
 Six trap efficiency experiments were conducted with naturally spawned juvenile Chinook salmon marked caudal fin green (CFG). Preliminary estimates of capture efficiency are provided in Table 4. Table 4. Trap efficiency tests conducted at Oakdale (RM 40) between March 5 and March 18, 2012.
Daily average flows at Goodwin Dam (GDW) ranged from 300 cfs to 317 cfs, and at Ripon (RIP) ranged from 333 cfs to 448 cfs.Instantaneous water temperatures taken at the trap ranged from 48.2ºF to 54.8ºF, and turbidity ranged from 0.63 NTU to 5.99 NTU. 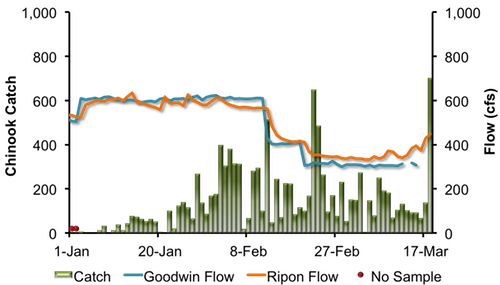
Figure 4. Daily Chinook salmon catch at Oakdale (RM 40) and daily average Stanislaus River flows at Goodwin Dam (GDW) and Ripon (RIP) between January 1, 2012, and March 18, 2012.
At time of this report information from monitoring at Caswell State Park (RM 8) between March 5 and March 18 is not available.
|
2012 Tuolumne River Juvenile Migration Monitoring
 The Tuolumne River rotary screw trap at Waterford (RM 30) operated continuously between March 5 and March 18. A total of 188 juvenile Chinook salmon were captured, increasing the season total to 2,683. Daily catch ranged between 0 and 36 Chinook (Figure 5). Average forklengths and weights of all measured Chinook salmon are provided in Table 5. Most of the Chinook salmon captured were parr (n=93), but fry (n=53) and smolt (n=37) were also observed. The Tuolumne River rotary screw trap at Waterford (RM 30) operated continuously between March 5 and March 18. A total of 188 juvenile Chinook salmon were captured, increasing the season total to 2,683. Daily catch ranged between 0 and 36 Chinook (Figure 5). Average forklengths and weights of all measured Chinook salmon are provided in Table 5. Most of the Chinook salmon captured were parr (n=93), but fry (n=53) and smolt (n=37) were also observed.
No O. mykiss were captured, and the season total remains at zero.
Table 5. Biosampling data for Chinook salmon captured and measured at Waterford (RM 30) between March 5 and March 18, 2012. Parentheses indicate range. One trap efficiency experiment was conducted with naturally spawned juvenile Chinook salmon marked caudal fin orange (CFO). Preliminary estimate of capture efficiency is provided in Table 6.
Table 6. Trap efficiency tests conducted at Waterford (RM 30) between March 5 and March 18, 2012.
 Daily average flows at La Grange (LGN) were relatively stable, between 318 cfs and 335 cfs. Instantaneous water temperatures taken at the trap ranged from 50.9ºF to 57.2ºF, and turbidity ranged from 0.25 NTU to 2.57 NTU.
 Figure 5. Daily Chinook salmon catch at Waterford (RM 30) and daily average Tuolumne River flows at La Grange (LGN) and Modesto (MOD) between December 1, 2011, and March 18, 2012. The Tuolumne River rotary screw traps at Grayson (RM 5) operated continuously between March 5 and March 18. No Chinook salmon were captured during the reporting period. Season total remains at nine (Figure 6). No O. mykiss were captured, and the season total remains at zero. No trap efficiency experiments were conducted. Daily average flow at Modesto (MOD) was stable during the reporting period, ranging between 418 cfs and 461 cfs. Instantaneous water temperatures taken at the trap ranged from 53.9ºF to 58.6ºF, and turbidity ranged from 1.50 NTU to 7.66 NTU. Figure 6. Daily Chinook salmon catch at Grayson and Tuolumne River flow recorded at La Grange (LGN) and Modesto (MOD) between January 1 and March 18, 2012.
|
2011/12 Mokelumne River Juvenile Migration Monitoring
The Mokelumne River rotary screw trap at Vino Farms (RM 54) sampled intermittently between March 5 and March 18. A total of 495 juvenile Chinook salmon were captured, bringing the season total to 11,827. Daily catch ranged between 26 and 199 Chinook (Figure 7).
Four O. mykiss were captured, increasing the season total to sixteen.
Daily average flows from Camanche Reservoir (CMN) were stable, ranging from 258 cfs to 301 cfs. Instantaneous water temperatures ranged between 50.2°F and 53.2°F, and instantaneous turbidity ranged between 1.77 NTU and 3.07 NTU.
 Figure 7. Daily juvenile Chinook catch at Vino Farms (RM 54) and daily averageMokelumne River flows at Camanche Reservoir (CMN) between December 1, 2011, and March 18, 2012. The Mokelumne River rotary screw trap at Golf (RM 38) sampled intermittently February 20 and March 4. A total of 177 juvenile Chinook salmon were captured, bringing the season total to 873. Daily catch ranged between 1 and 50 Chinook (Figure 8). A total of 115 O. mykiss were captured, increasing the season total to 144. (Note: 113 were identified as hatchery origin, increasing the season total to 135.) Daily average flows recorded at Woodbridge (WBR) ranged from 139 cfs to 207 cfs. Instantaneous water temperatures ranged between 50.2°F and 55.4°F, and turbidity ranged between 1.71 NTU and 2.90 NTU.
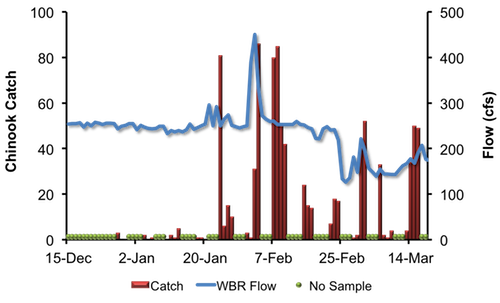
Figure 8. Daily juvenile Chinook catch at Golf (RM 38) and daily averageMokelumne River flows at Woodbridge (WBR), between December 15, 2011, and March 18, 2012.
|
2011 Stanislaus River Weir Adult Migration Monitoring
The Stanislaus River Weir and Vaki Riverwatcher (RM 31) sampled continuously between March 5 and March 18. No Chinook salmon were detected during the reporting period. The season total remains at 817.
Three O. mykiss were detected passing upstream of the weir, increasing the season total to 78. The adipose fins of hatchery origin O. mykiss are clipped before release. Two of the O. mykiss captured during the reporting period were positively identified as hatchery origin (ad-clipped), and one was positively identified as naturally spawned origin. The season totals for passage of O. mykiss are now 50 hatchery origin, 14 natural spawned origin, and 14 that could not be determined.
Other fish passing upstream of the weir included 1 Striped bass and 876 Sacramento suckers (Table 7).
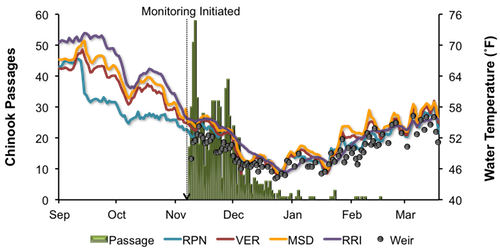
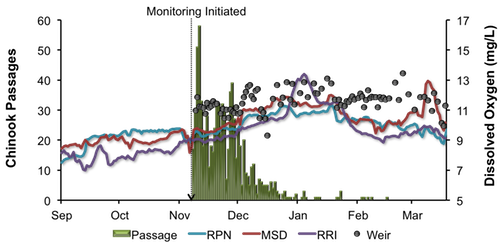
Daily average flows in the Stanislaus River at Goodwin Dam (GDW; RM 58) were stable, between 300 cfs and 317 cfs (Figure 9). Flows at Ripon (RIP; RM 15) fluctuated between 333 cfs and 448 cfs. Note: flows downstream of Goodwin Dam may differ from dam releases due to irrigation, precipitation and other factors. Instantaneous water temperature measured at the weir ranged between 51.2˚F and 56.3˚F, and daily average water temperature at Ripon (RPN; RM 15) ranged between 53.8˚F and 58.4˚F (Figure 10). Instantaneous turbidity at the weir ranged between 0.94 NTU and 3.59 NTU (Figure 11). Instantaneous dissolved oxygen at the weir ranged between 9.96 mg/L and 12.12 mg/L, and daily average dissolved oxygen at Ripon (RPN; RM 15) ranged from 8.77 mg/L to 9.88 mg/L (Figure 12).
Table 7. Net passage counts for all species between March 5 and March 18, 2012, at the Stanislaus River weir (RM 31).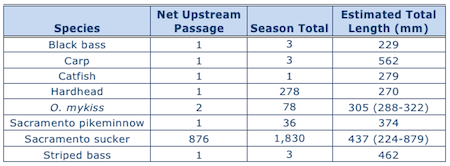 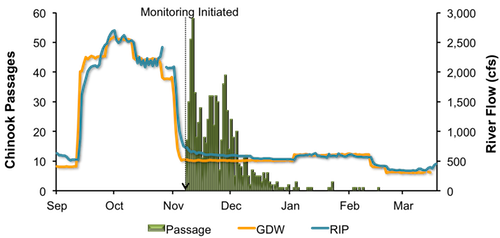 Figure 9. Daily upstream Chinook passage at the Stanislaus River weir in relation to daily average flows (cfs) recorded in the Stanislaus River at Goodwin (GDW) and Ripon (RIP), September 1, 2011 and March 18, 2012. Figure 10. Daily upstream Chinook passage recorded at the Stanislaus River weir in relation to instantaneous water temperature recorded at the weir, and daily average water temperature recorded in the Stanislaus River at Ripon (RPN), and in the San Joaquin River at Vernalis (VER), Mossdale (MSD) and Rough & Ready (RRI), September 1, 2011 and March 18, 2012.
Figure 11. Daily upstream Chinook passage at the Stanislaus River weir in relation to instantaneous turbidity recorded at the weir, September 1, 2011 and March 18, 2012.
Figure 12. Daily upstream Chinook passage at the Stanislaus River weir in relation to instantaneous dissolved oxygen recorded at the weir, and daily average dissolved oxygen recorded in the Stanislaus River at Ripon (RPN), and in the San Joaquin River at Mossdale (MSD) and Rough & Ready (RRI), September 1, 2011 and March 18, 2012.
|
2011 Tuolumne River Weir Adult Migration Monitoring
The Tuolumne River Weir and Vaki Riverwatcher (RM 22) sampled continuously between March 5 and March 18. A total of nine Chinook salmon were detected as they passed upstream of the weir, increasing the season total to 2,860. Daily passage ranged between zero and two Chinook salmon.
Two O. mykiss were detected passing upstream of the weir during the reporting period, increasing the season total to 11. The adipose fins of hatchery origin O. mykiss are clipped before release. Both of the O. mykiss passing through the Riverwatcher during the reporting period were positively identified as naturally spawned origin. The season totals for passage of O. mykiss are now two hatchery origin and nine natural spawned origin.
Other fish passing upstream of the weir included 18 black bass and 960 Sacramento suckers (Table 8).
Daily average flows in the Tuolumne River ranged from 319 cfs to 335 cfs at La Grange (LGN; RM 50) and from 418 cfs to 596 cfs at Modesto (MOD; RM 17). Note: flows downstream of La Grange may be higher than dam releases due to accretion and Dry Creek inflows (Figure 13). Instantaneous water temperatures measured at the weir ranged from 54.2˚F and 57.9˚F and daily average water temperatures at Modesto ranged from 54.0˚F and 57.4˚F (Figure 14). Instantaneous turbidity at the weir ranged between 1.15 NTU and 2.27 NTU (Figure 15), and dissolved oxygen ranged between 10.31 mg/L and 13.57 mg/L (Figure 16).
Table 8. Net passage counts for all species between March 5 and March 18, 2012 at the Tuolumne River (RM 22).
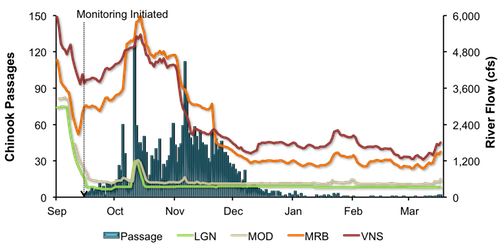
Figure 13. Daily upstream Chinook passage at the Tuolumne River weir in relation to daily average flows (cfs) recorded in the Tuolumne River at La Grange (LGN) and Modesto (MOD), and in the San Joaquin River at Maze Road Bridge (MRB) and Vernalis (VNS), September 1, 2011 and March 18, 2012.
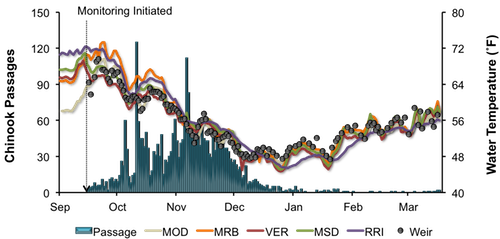
Figure 14. Daily upstream Chinook passage at the Tuolumne River weir in relation to instantaneous water temperature recorded at the weir, and daily average water temperature recorded in the Tuolumne River at Modesto (MOD) and in the San Joaquin River at Maze Road Bridge (MRB), Vernalis (VER), Mossdale (MSD) and Rough & Ready (RRI), September 1, 2011 and March 18, 2012.

Figure 15. Daily upstream Chinook passage at the Tuolumne River weir in relation to instantaneous turbidity recorded at the weir, September 1, 2011 and March 18, 2012.
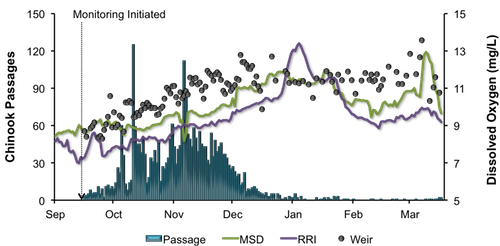
Figure 16. Daily upstream Chinook passage at the Tuolumne River weir in relation to instantaneous dissolved oxygen recorded at the weir, and daily average dissolved oxygen recorded in the San Joaquin River at Mossdale (MSD) and Rough & Ready (RRI), September 1, 2011 and March 18, 2012.
|
San Joaquin River Conditions
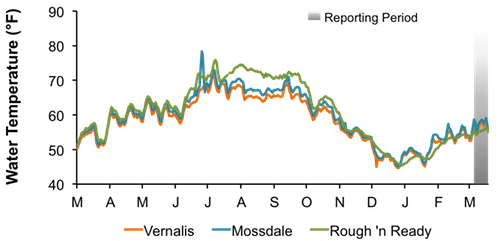
During the reporting period, flow in the San Joaquin River at Vernalis ranged from 1,236 cfs to 2,033 cfs (Figure 17). Daily average water temperature in the San Joaquin River ranged from 54.1°F to 59.2°F at Vernalis, from 54.9°F to 59.0°F at Mossdale, and from 54.3°F to 56.2°F at Rough 'n Ready Island (Figure 18). Daily average dissolved oxygen (DO) in the San Joaquin River fluctuated from 9.7 mg/L to 12.9 mg/L at Mossdale, and from 9.1 mg/L to 10.0 mg/L in the deep-water ship channel (measured at Rough 'n Ready Island; Figure 19).
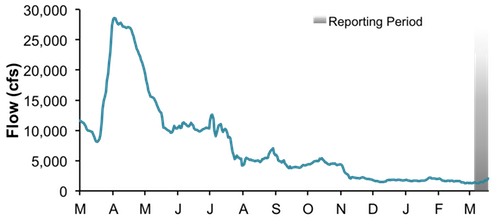
Figure 17. San Joaquin River flow at Vernalis from March 1, 2011, through March 18, 2012.
Figure 18. San Joaquin River daily average water temperature at Vernalis, Mossdale, and Rough 'n Ready from March 1, 2011, through March 18, 2012.
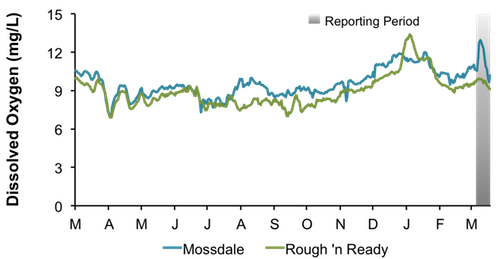
Figure 19. San Joaquin River daily average dissolved oxygen at Mossdale and Rough 'n Ready, from March 1, 2011, through March 18, 2012.
|
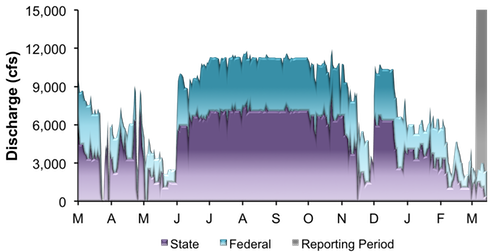
Delta ExportsMean daily pumping at the C.W. Jones Pumping Plant (federal pumps previously known as Tracy Pumping Plant) ranged from 997 cfs to 2,849 cfs (Figure 20). Mean daily pumping at the Harvey O. Banks Pumping Plant (state pumps) ranged from 375 cfs to 1,476 cfs. Combined total exports (state and federal pumps) fluctuated during this reporting period, ranging from 1,844 cfs to 3,950 cfs.
Figure 20. Daily exports at the state and federal pumping stations from March 1, 2011, through March 18, 2012.
|
|
|
|
|
|
|