| Volume 2012, Issue 12 | March 13, 2012 |
|

Cal-Neva AFS Meeting:
March 28-31
Salmonid Restoration Federation Conference:
April 4-7
Pick and Gather at Riverdance Farms and Merced River Fair:
June 2-3
National Conference on Engineering & Ecohydrology for Fish Passage:
June 5-7
|
|
|
Key Highlights
February 20, 2012 - March 4, 2012
Calaveras River Juvenile Migration Monitoring continued at Shelton Road (RM 28) during the reporting period.A total of 22 O. mykiss were captured, increasing the season total to 93.
Stanislaus River Juvenile Migration Monitoring continued at Oakdale (RM 40) during the reporting period. A total of 2,875 Chinook salmon were captured, increasing the season total to 8,280. One O. mykiss was captured, increasing the season total to 17. Monitoring at Caswell State Park (RM 8) continued during the reporting period. A total of 17 Chinook salmon were captured, increasing the season total to 105.
Tuolumne River Juvenile Migration Monitoring continued at Waterford (RM 30) during the reporting period. A total of 760 Chinook salmon were captured, increasing the season total to 2,495. No O. mykiss have been captured this season. Monitoring at Grayson (RM 5) continued during the reporting period. A total of three Chinook salmon were captured, increasing the season total to nine. No O. mykiss have been captured this season.
Mokelumne River Juvenile Migration Monitoring continued at Vino Farms (RM 54) during the reporting period. A total of 1,833 Chinook salmon were captured, increasing the season total to 11,332. Seven O. mykiss were captured, increasing the season total to twelve. Monitoring at Golf (RM 38) continued during the reporting period. A total of 137 Chinook salmon were captured, increasing the season total to 696. One O. mykiss was captured, increasing the season total to 29.
Stanislaus River Weir Monitoring continued during the reporting period. No Chinook salmon passed upstream through the weir. The season total remains at 817. During the reporting period 18 O. mykiss passed upstream through the weir, increasing the season total to 75.
Tuolumne River Weir Monitoring continued during the reporting period. A total of 4 Chinook salmon passed upstream through the weir, increasing the season total to 2,851. No O. mykiss passed upstream through the weir during the reporting period; the season total remains at nine.
San Joaquin River Conditions. San Joaquin River flow at Vernalis ranged from 1,266 cfs to 1,611 cfs. Daily average water temperature in the San Joaquin River ranged from 52.5°F to 56.1°F at Vernalis, and from 53.3°F to 57.2°F at Mossdale. Daily average dissolved oxygen (DO) in the San Joaquin River ranged from 10.0 mg/L to 11.0 mg/L at Mossdale, and from 9.2 mg/L to 9.7 mg/L in the deep-water ship channel (measured at Rough 'n Ready Island).
Delta Exports. Combined total exports (state and federal pumps) fluctuated during the reporting period, ranging from 1,914 cfs to 4,177 cfs.
|
|
2011/12 Calaveras River Juvenile Migration Monitoring
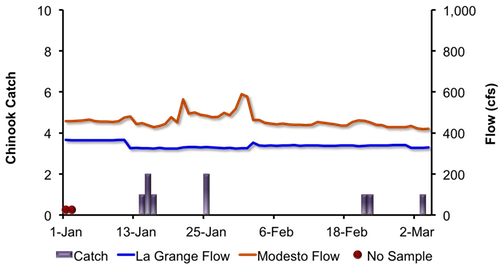
The Calaveras River rotary screw trap at Shelton Road (RM 28) sampled eight days between February 20 and March 4. A total of 22 O. mykiss were captured, increasing the season total to 93. Daily catch ranged from 0 to 10 individuals (Figure 1). Average forklengths and weights of the 19 measured O. mykiss are provided in Table 1. All of the O. mykiss measured were Age 1+ (100-299 mm), and were rated as silvery parr (n=9) or smolts (n=10). No Chinook salmon were captured during the reporting period; the season total remains at one. Daily average combined flows from New Hogan Dam (NHG) and Cosgrove Creek (COS) fluctuated between 25 cfs and 34 cfs, and at Bellota (MRS) flows ranged from 0 cfs to 5 cfs (Figure 1).Instantaneous water temperatures recorded at the trap ranged from 47.1ºF to 49.4ºF, and turbidity ranged from 0.43 NTU to 1.75 NTU. Table 1. Biosampling data for salmonids captured at Shelton Road (RM 28) between February 20 and March 4, 2012. Parenthesis indicates range.
 
Figure 1. Daily O. mykiss catch at Shelton Road in relation to Calaveras River flow recorded by New Hogan Dam (NHG) and Cosgrove Creek (COS) combined and recorded at Bellota (MRS) between October 15, 2011 and March 4, 2012.
|
2011/12 Stanislaus River Juvenile Migration Monitoring
 The Stanislaus River rotary screw trap at Oakdale (RM 40) sampled continuously between February 20 and March 4. A total of 2,875 Chinook salmon were captured, increasing the season total to 8,280. Daily catch ranged between 6 and 650 Chinook (Figure 2). Average forklengths and weights of all measured Chinook salmon are provided in Table 2. Most of the fish measured were fry (n=577), but parr (n=263) and smolt (n=44) were also observed. The Stanislaus River rotary screw trap at Oakdale (RM 40) sampled continuously between February 20 and March 4. A total of 2,875 Chinook salmon were captured, increasing the season total to 8,280. Daily catch ranged between 6 and 650 Chinook (Figure 2). Average forklengths and weights of all measured Chinook salmon are provided in Table 2. Most of the fish measured were fry (n=577), but parr (n=263) and smolt (n=44) were also observed.
One O. mykiss was captured during the reporting period, increasing the season total to 17.
Table 2. Biosampling data for salmonids captured and measured at Oakdale (RM 40) between February 20 and March 4, 2012.
 Six trap efficiency experiments were conducted with naturally spawned juvenile Chinook salmon marked caudal fin green (CFG). Preliminary estimates of capture efficiency are provided in Table 3. Table 3. Trap efficiency tests conducted at Oakdale (RM 40) between February 20 and March 4, 2012.
Daily average flows at Goodwin Dam (GDW) ranged from 301 cfs to 325 cfs, and at Ripon (RIP) ranged from 334 cfs to 412 cfs (Figure 2). Instantaneous water temperatures taken at the trap ranged from 48.0ºF to 51.0ºF, and turbidity ranged from 0.33 NTU to 2.90 NTU. 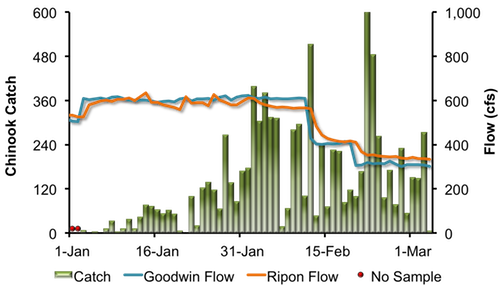
Figure 2. Daily Chinook salmon catch at Oakdale and Stanislaus River flow recorded at Goodwin Dam (GDW) and Ripon (RIP) between January 1, 2012 and March 4, 2012.
The Stanislaus River rotary screw trap at Caswell State Park (RM 8) operated continuously between February 20 and March 4.A total of 17 juvenile Chinook salmon were captured, increasing the season total to 105. No O. mykiss were captured, and the season total remains at zero.
No trap efficiency experiments were conducted.
|
2012 Tuolumne River Juvenile Migration Monitoring
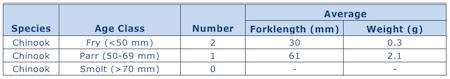
The Tuolumne River rotary screw trap at Waterford (RM 30) operated continuously between February 20 and March 4. A total of 760 juvenile Chinook salmon were captured, increasing the season total to 2,495. Daily catch ranged between 22 and 109 Chinook (Figure 5). Average forklengths and weights of all measured Chinook salmon are provided in Table 4. Most of the Chinook salmon captured were fry (n=543), but parr (n=84) and smolt (n=24) were also observed.
No O. mykiss were captured, and the season total remains at zero.
Table 4. Biosampling data for Chinook salmon captured and measured at Waterford (RM 30) between February 20 and March 4, 2012. Parentheses indicate range. Four trap efficiency experiments were conducted with naturally spawned juvenile Chinook salmon marked caudal fin orange (CFO). Preliminary estimates of capture efficiency are provided in Table 5. Table 5. Trap efficiency tests conducted at Waterford (RM 30) between February 20 and March 4, 2012. 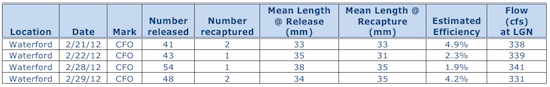 Daily average flows at La Grange (LGN) were relatively stable, between 327 cfs and 342 cfs (Figure 3). Instantaneous water temperatures taken at the trap ranged from 49.8ºF to 56.9ºF, and turbidity ranged from 0.71 NTU to 2.25 NTU.
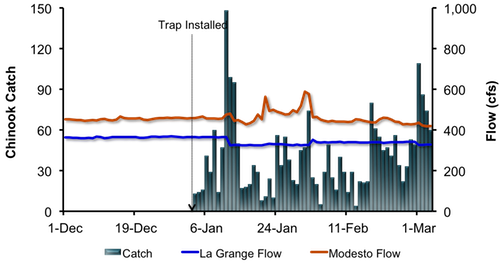 Figure 3. Daily Chinook salmon catch at Waterford (RM 30) and daily average Tuolumne River flows at La Grange (LGN) and Modesto (MOD) between December 1, 2011, and March 4, 2012. The Tuolumne River rotary screw traps at Grayson (RM 5) operated continuously between February 20 and March 4. A total of three Chinook salmon were captured, increasing the season total to nine (Figure 4). Daily catch ranged between zero and one Chinook. Average forklengths and weights of all Chinook salmon are provided in Table 6. Two of the Chinook salmon captured were fry and one was rated as a parr. No O. mykiss were captured, and the season total remains at zero.
Table 6. Biosampling data for Chinook salmon captured and measured at Waterford (RM 30) between February 20 and March 4, 2012. Parentheses indicate range.
No trap efficiency experiments were conducted. Daily average flow at Modesto (MOD) was stable during the reporting period, ranging between 418 cfs and 461 cfs (Figure 4). Instantaneous water temperatures taken at the trap ranged from 51.2ºF to 57.5ºF, and turbidity ranged from 1.01 NTU to 2.70 NTU.
Figure 4. Daily Chinook salmon catch at Grayson and Tuolumne River flow recorded at La Grange (LGN) and Modesto (MOD) between January 1 and March 4, 2012.
|
2011/12 Mokelumne River Juvenile Migration Monitoring
The Mokelumne River rotary screw trap at Vino Farms (RM 54) sampled intermittently between February 20 and March 4. A total of 1,833 juvenile Chinook salmon were captured, bringing the season total to 11,332. Daily catch ranged between 59 and 440 Chinook (Figure 5).
Seven O. mykiss were captured, increasing the season total to twelve.
Daily average flows from Camanche Reservoir (CMN) were stable, ranging from 259 cfs to 336 cfs (Figure 5). Instantaneous water temperatures ranged between 48.6°F and 50.4°F, and instantaneous turbidity ranged between 1.61 NTU and 2.67 NTU.
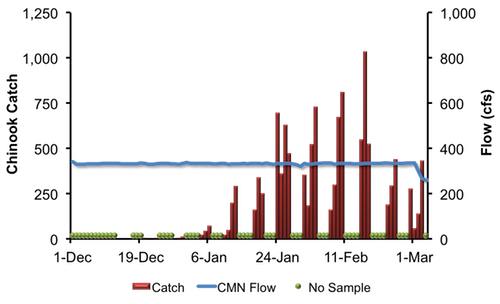 Figure 5. Daily juvenile Chinook catch at Vino Farms (RM 54) and daily averageMokelumne River flows at Camanche Reservoir (CMN) between December 1, 2011, and March 4, 2012. The Mokelumne River rotary screw trap at Golf (RM 38) sampled intermittently February 20 and March 4. A total of 137 juvenile Chinook salmon were captured, bringing the season total to 696. Daily catch ranged between 1 and 52 Chinook (Figure 6). One O. mykiss was captured, increasing the season total to 29. Daily average flows recorded at Woodbridge (WBR) ranged from 126 cfs to 248 cfs (Figure 6). Instantaneous water temperatures ranged between 50.2°F and 52.0°F, and turbidity ranged between 1.45 NTU and 3.53 NTU.
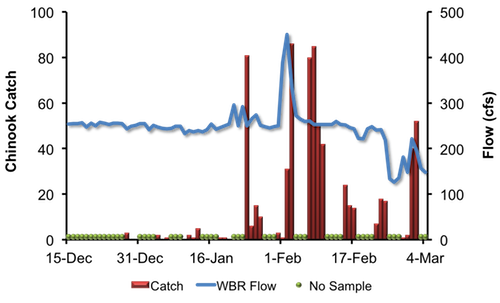
Figure 6. Daily juvenile Chinook catch at Golf and Mokelumne River flow recorded at Woodbridge (WBR), between December 15, 2011, and March 4, 2012.
|
2011 Stanislaus River Weir Adult Migration Monitoring
The Stanislaus River Weir and Vaki Riverwatcher (RM 31) sampled continuously between February 20 and March 4. No Chinook salmon were detected during the reporting period. The season total remains at 817.
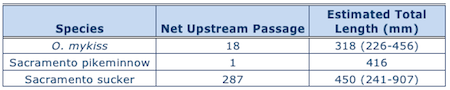
 Eighteen O. mykiss were detected passing upstream of the weir, increasing the season total to 75 (Table 7).All O. mykiss of hatchery origin are adipose fin-clipped prior to release into anadromous waters. Fifteen of these fish were positively identified as hatchery origin (ad-clipped) and three were positively identified as naturally spawned origin. The season totals for passage of O. mykiss are now 48 hatchery origin, 13 natural spawned origin, and 14 that could not be determined. Eighteen O. mykiss were detected passing upstream of the weir, increasing the season total to 75 (Table 7).All O. mykiss of hatchery origin are adipose fin-clipped prior to release into anadromous waters. Fifteen of these fish were positively identified as hatchery origin (ad-clipped) and three were positively identified as naturally spawned origin. The season totals for passage of O. mykiss are now 48 hatchery origin, 13 natural spawned origin, and 14 that could not be determined.
Other fish passing upstream of the weir included 1 Sacramento pikeminnow and 287 Sacramento suckers (Table 7).
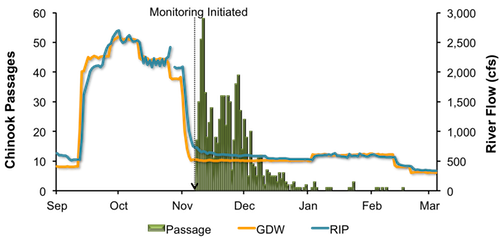
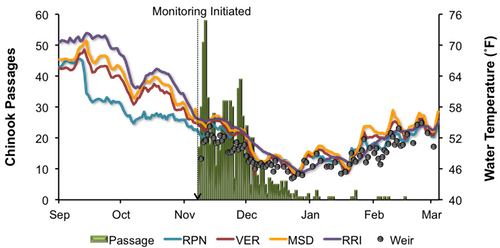
Daily average flows in the Stanislaus River at Goodwin Dam (GDW; RM 58) were stable, between 301 cfs and 319 cfs (Figure 7). Flows at Ripon (RIP; RM 15) fluctuated between 334 cfs and 412 cfs. Note: flows downstream of Goodwin Dam may differ from dam releases due to irrigation, precipitation and other factors. Instantaneous water temperature measured at the weir ranged between 50.3˚F and 55.0˚F, and daily average water temperature at Ripon (RPN; RM 15) ranged between 52.3˚F and 55.3˚F (Figure 8). Instantaneous turbidity at the weir ranged between 0.82 NTU and 2.59 NTU (Figure 9). Instantaneous dissolved oxygen at the weir ranged between 11.04 mg/L and 13.45 mg/L, and daily average dissolved oxygen at Ripon (RPN; RM 15) ranged from 9.68 mg/L to 10.18 mg/L (Figure 10).
Table 6. Net passage counts for all species between February 20 and March 4, 2012 at the Stanislaus River Weir. Figure 7. Daily upstream Chinook passage at the Stanislaus River weir in relation to daily average flows (cfs) recorded in the Stanislaus River at Goodwin (GDW) and Ripon (RIP), September 1, 2011 and March 4, 2012. Figure 8. Daily upstream Chinook passage recorded at the Stanislaus River weir in relation to instantaneous water temperature recorded at the weir, and daily average water temperature recorded in the Stanislaus River at Ripon (RPN), and in the San Joaquin River at Vernalis (VER), Mossdale (MSD) and Rough & Ready (RRI), September 1, 2011 and March 4, 2012.
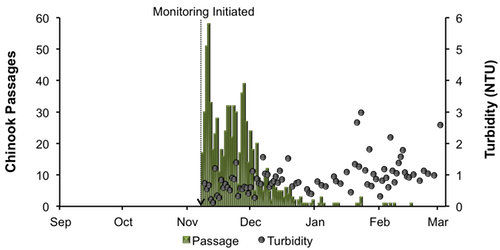
Figure 9. Daily upstream Chinook passage at the Stanislaus River weir in relation to instantaneous turbidity recorded at the weir, September 1, 2011 and March 4, 2012.
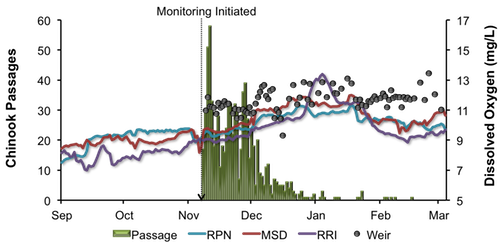
Figure 10. Daily upstream Chinook passage at the Stanislaus River weir in relation to instantaneous dissolved oxygen recorded at the weir, and daily average dissolved oxygen recorded in the Stanislaus River at Ripon (RPN), and in the San Joaquin River at Mossdale (MSD) and Rough & Ready (RRI), September 1, 2011 and March 4, 2012.
|
2011 Tuolumne River Weir Adult Migration Monitoring
The Tuolumne River Weir and Vaki Riverwatcher (RM 22) sampled continuously between February 20 and March 4. A total of four Chinook salmon  were detected as they passed upstream of the weir, increasing the season total to 2,851 (Table 8). Daily passage ranged between zero and one Chinook salmon. were detected as they passed upstream of the weir, increasing the season total to 2,851 (Table 8). Daily passage ranged between zero and one Chinook salmon.
No O. mykiss were detected passing upstream of the weir during the reporting period; the season total remains at ten.
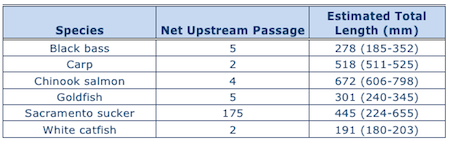
Other fish passing upstream of the weir included 5 black bass and 175 Sacramento suckers (Table 8).
Daily average flows in the Tuolumne River ranged from 327 cfs to 342 cfs at La Grange (LGN; RM 50) and from 418 cfs to 461 cfs at Modesto (MOD; RM 17). Note: flows downstream of La Grange may be higher than dam releases due to accretion and Dry Creek inflows (Figure 11). Instantaneous water temperatures measured at the weir ranged from 53.0˚F and 58.8˚F and daily average water temperatures at Modesto ranged from 53.1˚F and 55.0˚F (Figure 12). Instantaneous turbidity at the weir ranged between 0.53 NTU and 3.38 NTU (Figure 13), and dissolved oxygen ranged between 11.22 mg/L and 12.84 mg/L (Figure 14).
Table 7. Net passage counts for all species between February 20 and March 4, 2012 at the Tuolumne River.
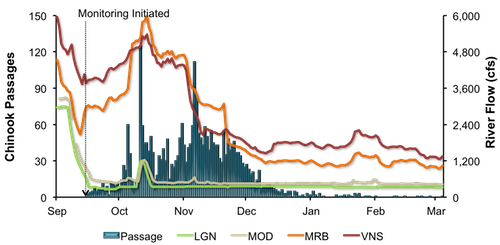
Figure 11. Daily upstream Chinook passage at the Tuolumne River weir in relation to daily average flows (cfs) recorded in the Tuolumne River at La Grange (LGN) and Modesto (MOD), and in the San Joaquin River at Maze Road Bridge (MRB) and Vernalis (VNS), September 1, 2011 and March 4, 2012. 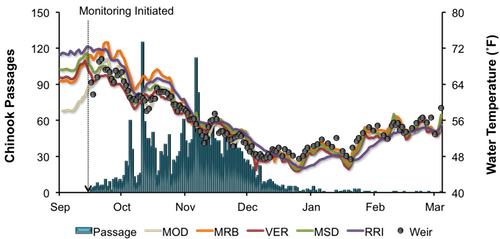
Figure 12. Daily upstream Chinook passage at the Tuolumne River weir in relation to instantaneous water temperature recorded at the weir, and daily average water temperature recorded in the Tuolumne River at Modesto (MOD) and in the San Joaquin River at Maze Road Bridge (MRB), Vernalis (VER), Mossdale (MSD) and Rough & Ready (RRI), September 1, 2011 and March 4, 2012. 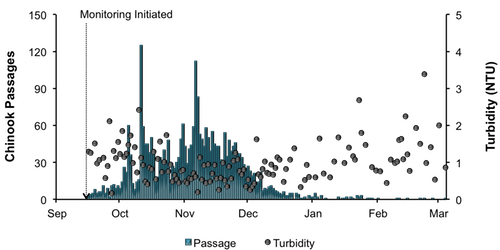
Figure 13. Daily upstream Chinook passage at the Tuolumne River weir in relation to instantaneous turbidity recorded at the weir, September 1, 2011 and March 4, 2012. 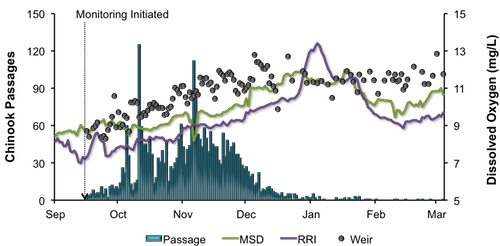
Figure 14. Daily upstream Chinook passage at the Tuolumne River weir in relation to instantaneous dissolved oxygen recorded at the weir, and daily average dissolved oxygen recorded in the San Joaquin River at Mossdale (MSD) and Rough & Ready (RRI), September 1, 2011 and March 4, 2012.
|
San Joaquin River Conditions
During the reporting period, flow in the San Joaquin River at Vernalis ranged from 1,266 cfs to 1,611 cfs (Figure 16). Daily average water temperature in the San Joaquin River ranged from 52.5°F to 56.1°F at Vernalis, from 53.3°F to 57.2°F at Mossdale, and from 53.6°F to 54.8°F at Rough 'n Ready Island (Figure 17). Daily average dissolved oxygen (DO) in the San Joaquin River fluctuated from 10.0 mg/L to 11.0 mg/L at Mossdale, and from 9.2 mg/L to 9.7 mg/L in the deep-water ship channel (measured at Rough 'n Ready Island; Figure 18).
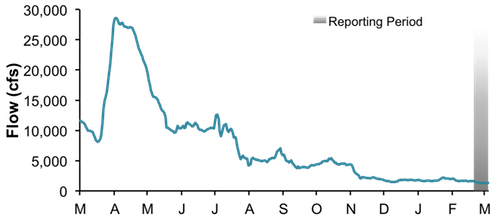
Figure 16. San Joaquin River flow at Vernalis from March 1, 2011, through March 4, 2012.
Figure 17. San Joaquin River daily average water temperature at Vernalis, Mossdale, and Rough 'n Ready from March 1, 2011, through March 4, 2012.
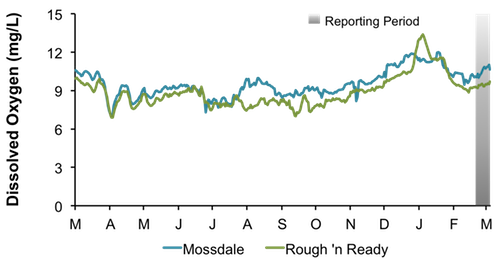
Figure 18. San Joaquin River daily average dissolved oxygen at Mossdale and Rough 'n Ready, from March 1, 2011, through March 4, 2012.
|
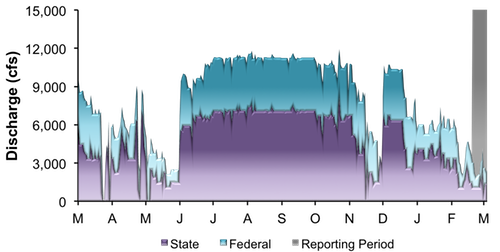
Delta ExportsMean daily pumping at the C.W. Jones Pumping Plant (federal pumps previously known as Tracy Pumping Plant) ranged from 813 cfs to 1,976 cfs (Figure 19). Mean daily pumping at the Harvey O. Banks Pumping Plant (state pumps) ranged from 725 cfs to 2,294 cfs. Combined total exports (state and federal pumps) fluctuated during this reporting period, ranging from 1,914 cfs to 4,177 cfs.
Figure 19. Daily exports at the state and federal pumping stations from March 1, 2011, through March 4, 2012.
|
|
|
|
|
|
|