| Volume 2012, Issue 10 | February 14, 2012 |
|

Cal-Neva AFS Meeting:
March 28-31
Salmonid Restoration Federation Conference:
April 4-7
Pick and Gather at Riverdance Farms and Merced River Fair:
June 2-3
National Conference on Engineering & Ecohydrology for Fish Passage:
June 5-7
|
|
|
Key Highlights
January 23, 2012 - February 5, 2012
Calaveras River Juvenile Migration Monitoring continued at Shelton Road (RM 28) during the reporting period.A total of 17 O. mykiss were captured, increasing the season total to 68.
Stanislaus River Juvenile Migration Monitoring continued at Oakdale (RM 40) during the reporting period. A total of 2,747 Chinook salmon were captured, increasing the season total to 3,431. Monitoring at Caswell State Park (RM 8) continued during the reporting period. A total of 62 Chinook salmon were captured, increasing the season total to 67.
Tuolumne River Juvenile Migration Monitoring continued at Waterford (RM 30) during the reporting period. A total of 481 Chinook salmon were captured, increasing the season total to 1,268. Monitoring at Grayson (RM 5) continued during the reporting period. A total of 2 Chinook salmon were captured, increasing the season total to 6.
Mokelumne River Juvenile Migration Monitoring continued at Vino Farms (RM 54) during the reporting period. A total of 3,952 Chinook salmon were captured, increasing the season total to 5,443. Monitoring at Golf (RM 38) continued during the reporting period. A total of 233 Chinook salmon were captured, increasing the season total to 249.
Stanislaus River Weir Monitoring continued during the reporting period. A total of 5 Chinook salmon passed upstream through the weir, increasing the total count since November 8th to 814.
Tuolumne River Weir Monitoring continued during the reporting period. A total of 9 Chinook salmon passed upstream through the weir, increasing the season total to 2,844.
Mokelumne River Woodbridge Dam Fish Ladder Monitoring ended on January 31 and no Chinook salmon passed upstream of the dam between January 23 and January 31. The season total remains at 18,596.
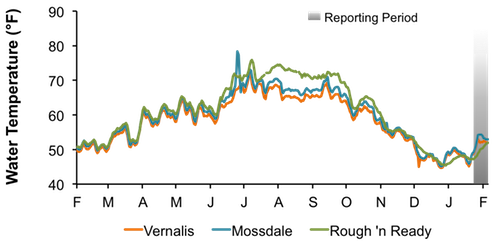
San Joaquin River Conditions. San Joaquin River flow at Vernalis ranged from 1,678 cfs to 2,206 cfs. Water temperature in the San Joaquin River ranged from 48.8°F to 53.1°F at Vernalis, and from 49.2°F to 54.3°F at Mossdale. Average daily dissolved oxygen (DO) in the San Joaquin River ranged from 11.0 mg/L to 12.0 mg/L at Mossdale, and from 9.4 mg/L to 11.4 mg/L at Rough 'n Ready.
Delta Exports. Combined total exports (state and federal pumps) fluctuated during the reporting period, ranging from 5,666 cfs to 6,751 cfs.
|
|
2011/12 Calaveras River Juvenile Migration Monitoring
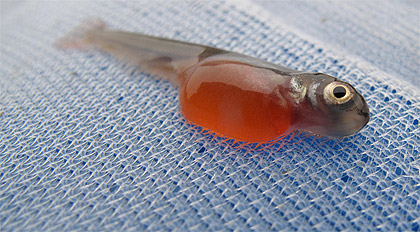
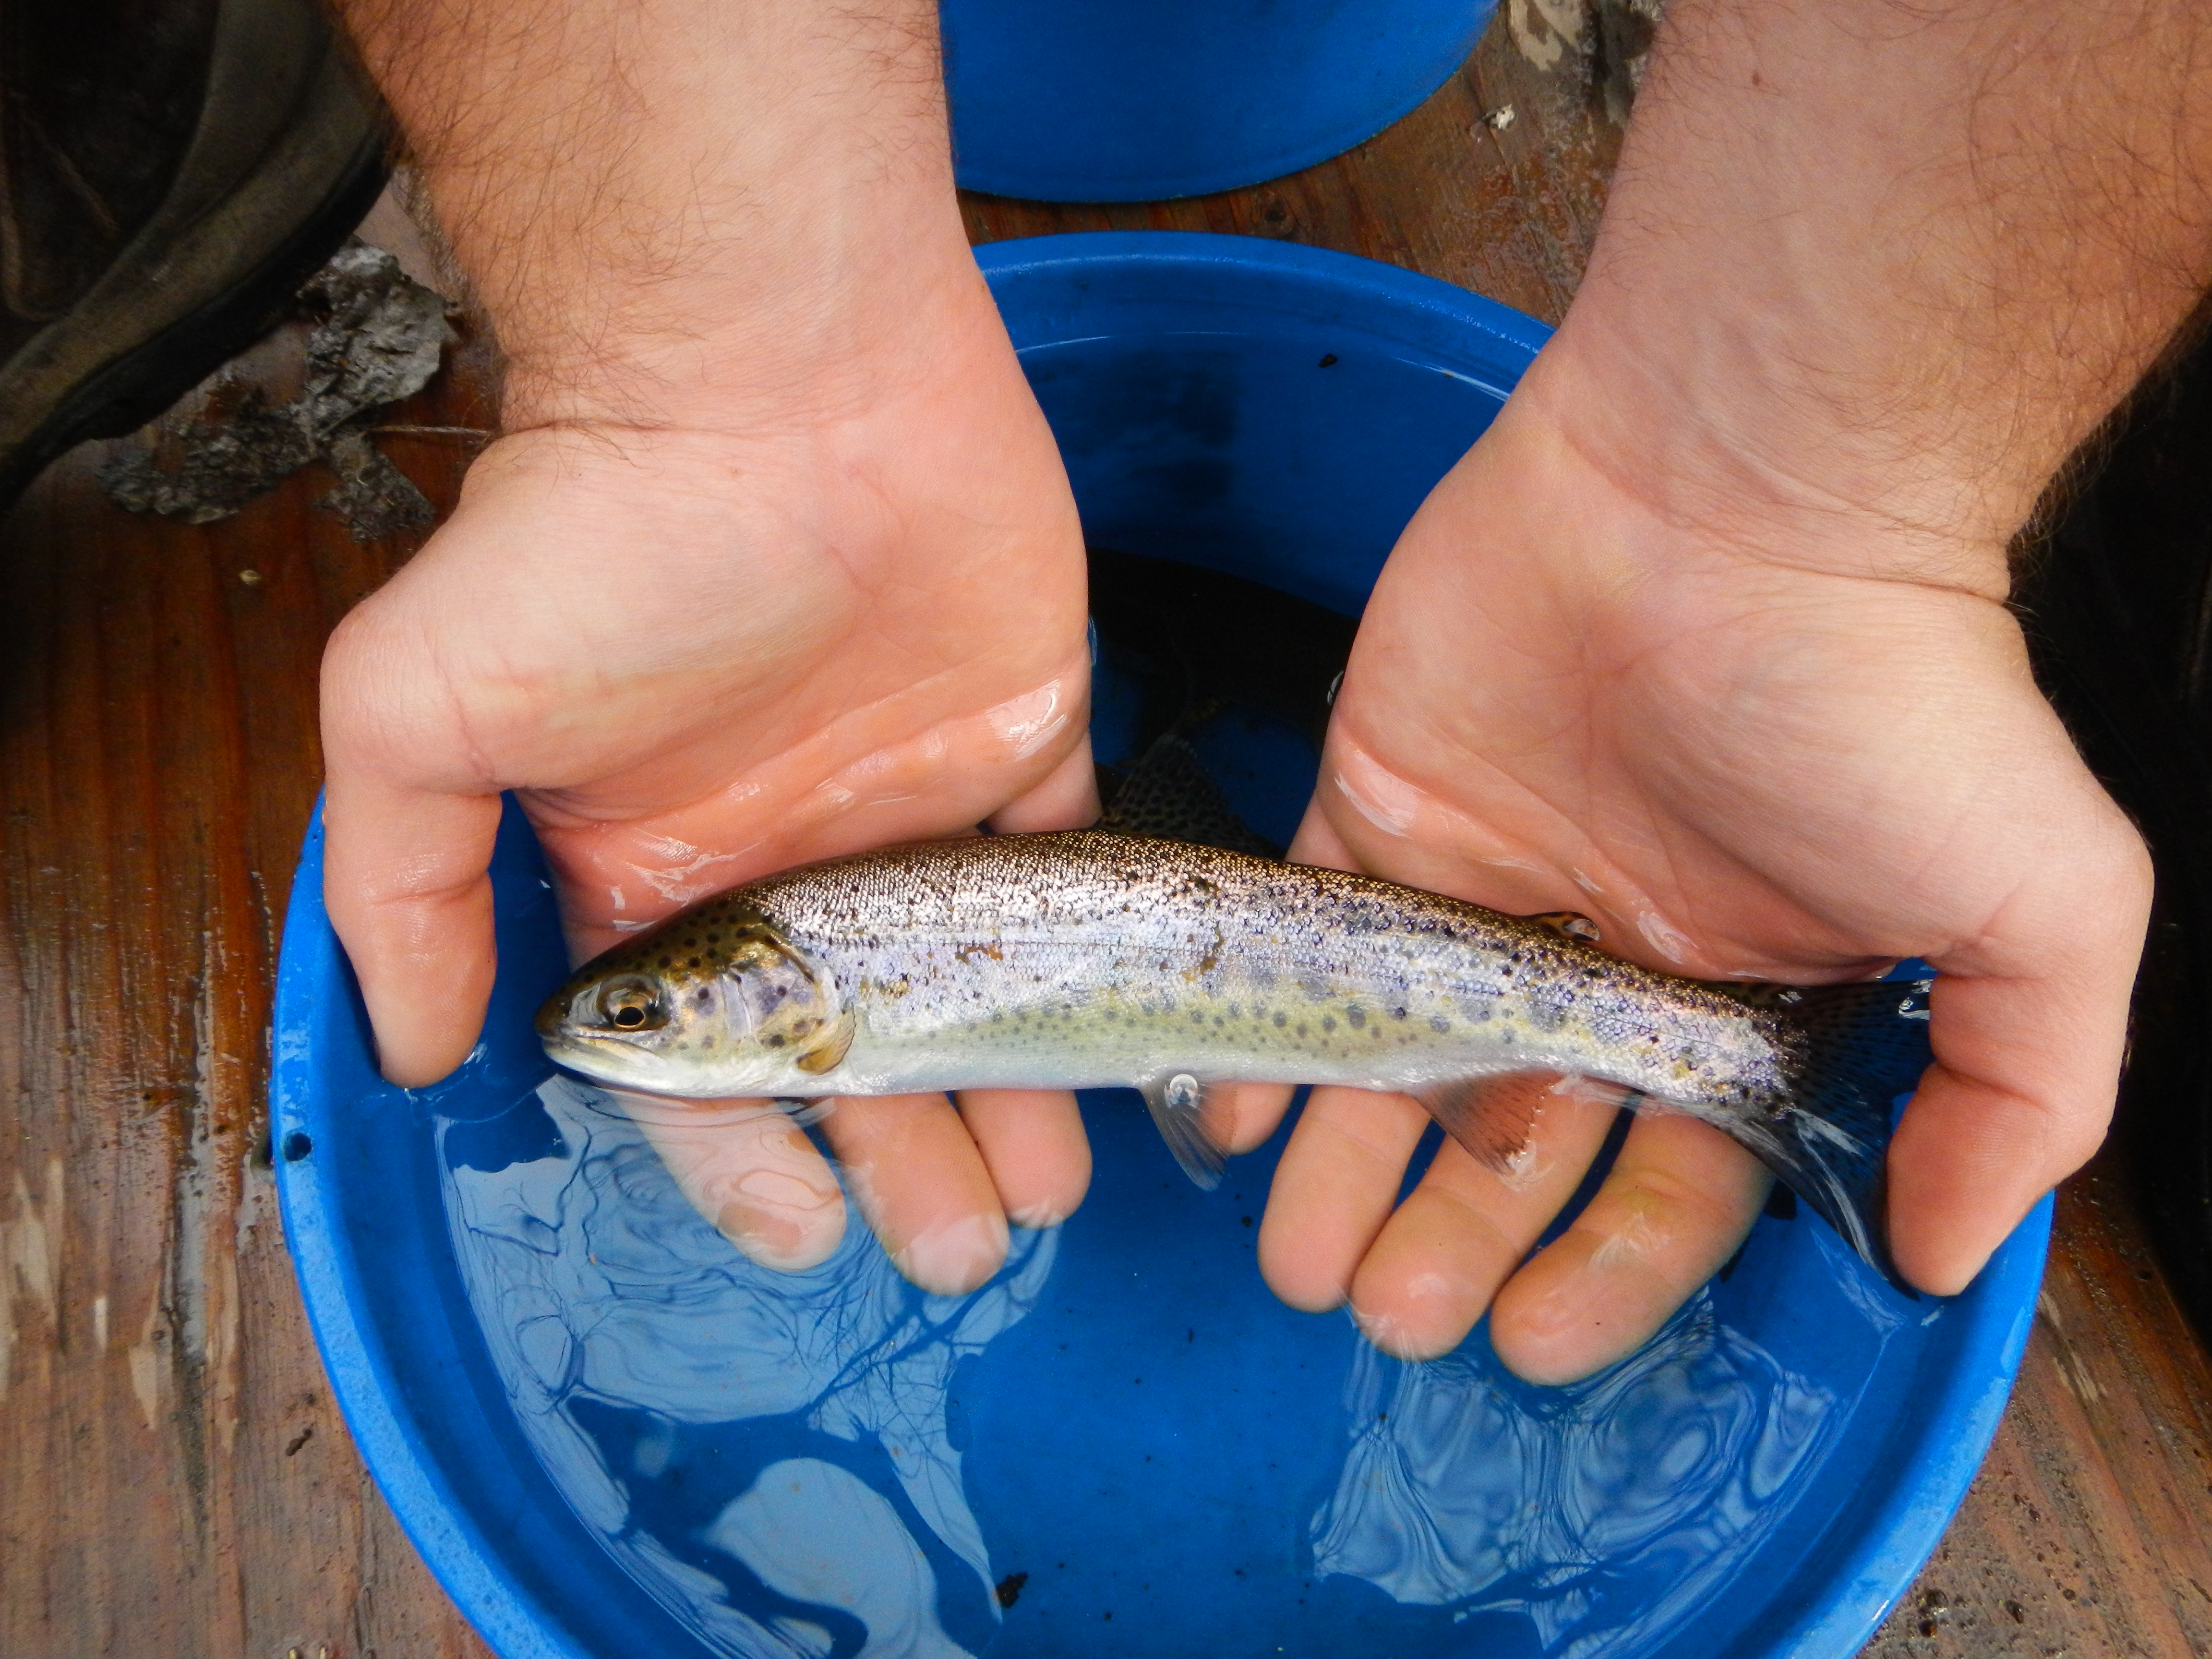 The Calaveras River rotary screw trap at Shelton Road (RM 28) sampled nine days between January 23 and February 5. A total of 17 O. mykiss were captured during the reporting period, increasing the season total to 68. Daily catches ranged from zero to eleven individuals (Figure 1), and all of the O. mykiss captured were Age 1+ (100-299 mm) and were rated as silvery parr (n=17). Average forklengths and weights of O. mykiss are provided in Table 1. The Calaveras River rotary screw trap at Shelton Road (RM 28) sampled nine days between January 23 and February 5. A total of 17 O. mykiss were captured during the reporting period, increasing the season total to 68. Daily catches ranged from zero to eleven individuals (Figure 1), and all of the O. mykiss captured were Age 1+ (100-299 mm) and were rated as silvery parr (n=17). Average forklengths and weights of O. mykiss are provided in Table 1.
No Chinook salmon were captured during this reporting period.
Instantaneous temperature recorded at the trap ranged from 45.5ºF to 50.3ºF, and turbidity ranged from 0.56 NTU to 1.43 NTU. During the reporting period, daily average combined flow from New Hogan Dam (NHG) and Cosgrove Creek (COS) fluctuated between 28 cfs and 37 cfs, and at Bellota (MRS) flow ranged from 9 cfs to 22 cfs.
Table 1. Biosampling data for O. mykiss captured at Shelton Road between January 23 and February 5, 2012. Parenthesis indicates range.
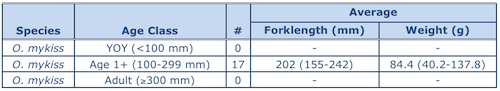 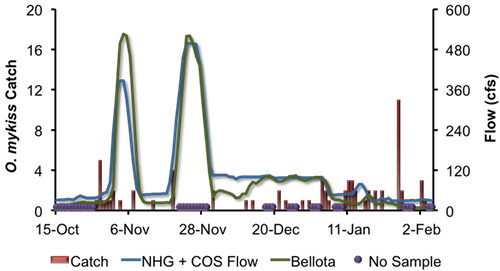
Figure 1. Daily O. mykiss catch at Shelton Road in relation to Calaveras River flow recorded by New Hogan Dam (NHG) and Cosgrove Creek (COS) combined and recorded at Bellota (MRS) between October 15, 2011 and February 5, 2012.
|
2011/12 Stanislaus River Juvenile Migration Monitoring
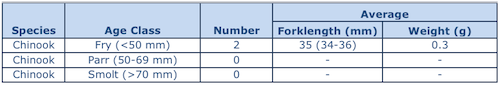
The Stanislaus River rotary screw trap at Oakdale (RM 40) operated continuously  between January 23 and February 5. A total of 2,747 Chinook salmon were captured during the reporting period, increasing the season total to 3,431. Daily catch ranged between 20 and 399 Chinook (Figure 2).Average forklengths and weights of all measured Chinook salmon are provided in Table 2. Most of the fish measured were fry (n=1,013), but parr (n=12) were also observed during the reporting period. between January 23 and February 5. A total of 2,747 Chinook salmon were captured during the reporting period, increasing the season total to 3,431. Daily catch ranged between 20 and 399 Chinook (Figure 2).Average forklengths and weights of all measured Chinook salmon are provided in Table 2. Most of the fish measured were fry (n=1,013), but parr (n=12) were also observed during the reporting period.
One O. mykiss was captured during the reporting period, increasing the season total to sixteen.
Instantaneous temperature taken at the trap ranged from 46.2ºF to 49.4ºF, and turbidity ranged from 0.25 NTU to 1.44 NTU. Daily average flow at Goodwin Dam (GDW) ranged from 602 cfs to 623 cfs, and flow ranged from 574 cfs to 628 cfs at Ripon (RIP) (Figure 2).
Table 2. Biosampling data for salmonids captured and measured at Oakdale between January 23 and February 5, 2012.
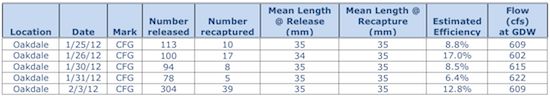
 Five trap efficiency experiments were conducted during the reporting period with naturally spawned juvenile Chinook salmon marked caudal fin green (CFG). The preliminary estimated capture efficiencies are provided in Table 3. Table 3. Trap efficiency tests conducted at Oakdale between January 23 and February 5, 2012. 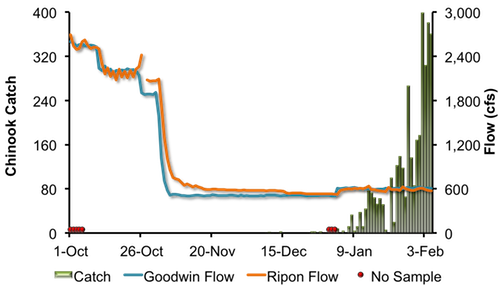
Figure 2. Daily Chinook salmon catch at Oakdale and Stanislaus River flow recorded at Goodwin Dam (GDW) and Ripon (RIP) between October 1, 2011 and February 5, 2012.
The Stanislaus River rotary screw trap at Caswell State Park (RM 8) operated continuously between January 23 and February 5.A total of 62 juvenile Chinook salmon were captured during the reporting period, increasing the season total to 67. No O. mykiss have been captured so far this season. No trap efficiency experiments were conducted during the reporting period.
Instantaneous temperature recorded at the trap ranged from 47.7°F and 50.5°F, and turbidity ranged from 1.30 NTU to 3.08 NTU. Daily average flow at Ripon (RIP) ranged from 574 cfs to 628 cfs.
|
2012 Tuolumne River Juvenile Migration Monitoring
The Tuolumne River rotary screw trap at Waterford (RM 30) operated continuously during the reporting period. A total of 481 juvenile Chinook salmon were captured increasing the season total to 1,268. Daily catch ranged between 5 and 74 Chinook (Figure 5). Average forklengths and weights of all measured Chinook salmon are provided in Table 4. Most of the Chinook salmon captured were fry (n = 473), but parr (n = 4) were also observed.
Table 4. Biosampling data for Chinook salmon captured and measured at Waterford between January 23 and February 5, 2012. Parentheses indicate range. No O. mykiss were captured during this reporting period.  Instantaneous temperature taken at the trap ranged from 49.1ºF to 53.2ºF, and turbidity ranged from 0.25 NTU to 3.18 NTU. Daily average flow at La Grange (LGN) fluctuated between 324 cfs and 352 cfs. Instantaneous temperature taken at the trap ranged from 49.1ºF to 53.2ºF, and turbidity ranged from 0.25 NTU to 3.18 NTU. Daily average flow at La Grange (LGN) fluctuated between 324 cfs and 352 cfs.
Four trap efficiency experiments were conducted during the reporting period with naturally spawned juvenile Chinook salmon marked caudal fin orange (CFO). The preliminary estimated capture efficiencies are provided in Table 5.
Table 5. Trap efficiency tests conducted at Waterford between January 23 and February 5, 2012.
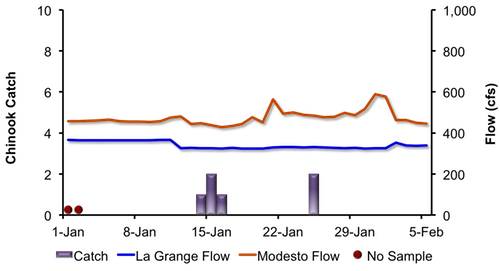
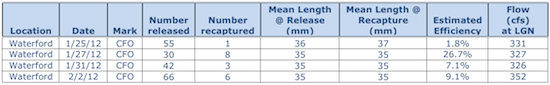 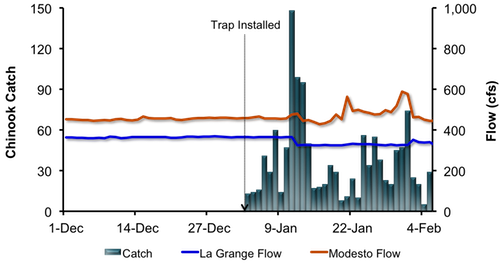 Figure 3. Daily Chinook salmon catch at Waterford and Tuolumne River flow recorded at La Grange (LGN) and Modesto (MOD) between December 1, 2011, and February 5, 2012. The Tuolumne River rotary screw traps at Grayson (RM 5) operated continuously during the reporting period. A total of 2 juvenile Chinook salmon fry were captured, increasing the season total to 6. Daily catch ranged between 0 and 2 Chinook (Figure 5). Average forklengths and weights of all Chinook salmon are provided in Table 6. Table 6. Biosampling data for Chinook salmon captured and measured at Waterford between January 9 and January 22, 2012. Parentheses indicate range.
No O. mykiss were captured during this reporting period.
Instantaneous temperature taken at the trap ranged from 50.1ºF to 53.7ºF, and turbidity ranged from 0.53 NTU to 3.57 NTU. Daily average flow at Modesto (MOD) was stable during the reporting period, ranging between 445 cfs and 589 cfs (Figure 4).
No trap efficiency experiments were conducted during the reporting period.Figure 4. Daily Chinook salmon catch at Grayson and Tuolumne River flow recorded at La Grange (LGN) and Modesto (MOD) between January 1 and February 5, 2012.
|
2011/12 Mokelumne River Juvenile Migration Monitoring
The Mokelumne River rotary screw trap at Vino Farms (RM 54) was sampled intermittently. A total of 3,952 juvenile Chinook salmon were captured during the reporting period, bringing the season total to 5,443. Daily catch ranged between 184 and 729 Chinook (Figure 5).
No O. mykiss were captured during the reporting period. Season total remains at 5.
Average daily flow from Camanche Reservoir (CMN) ranged from 321 cfs to 335 cfs (Figure 5). Instantaneous temperature ranged between 47.7°F and 49.8°F, and instantaneous turbidity ranged between 1.38 NTU and 7.03 NTU. 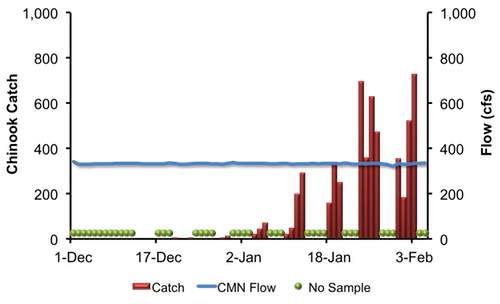 Figure 5. Daily juvenile Chinook catch at Vino Farms and Mokelumne River flow recorded at Camanche Reservoir (CMN), between December 1, 2011, and February 5, 2012. The Mokelumne River rotary screw trap at Golf (RM 38) was sampled intermittently. A total of 233 juvenile Chinook salmon were captured during the reporting period, bringing the season total to 249. Daily catch ranged between 1 and 86 Chinook (Figure 6). Average daily flow recorded at Woodbridge (WBR) ranged from 246 cfs to 450 cfs (Figure 6). Instantaneous temperature ranged between 48.6°F and 50.2°F, and instantaneous turbidity ranged between 1.77 NTU and 11.60 NTU.

Figure 6. Daily juvenile Chinook catch at Golf and Mokelumne River flow recorded at Woodbridge (WBR), between December 15, 2011, and February 5, 2012.
|
2011 Stanislaus River Weir Adult Migration Monitoring
Between January 23 and February 5 the Vaki Riverwatcher detected 5 Chinook salmon as they passed upstream of the Stanislaus River Weir increasing the season total since November 8th to 814.
Eight O. mykiss (400 mm) were detected passing upstream during this reporting period increasing the season total to fifty O. mykiss (Table 7). Of the 8 O. mykiss that were observed, 3 could be positively identified as hatchery origin, increasing the season total of ad-clipped fish to 24.
Daily average flow in the Stanislaus River at Goodwin Dam (GDW; RM 58) fluctuated between 602 cfs and 623 cfs (Figure 7). Flow at Ripon (RIP; RM 15) fluctuated between 574 cfs and 628 cfs. Note: flows downstream of Goodwin Dam may differ from dam releases due to irrigation, precipitation and other factors.
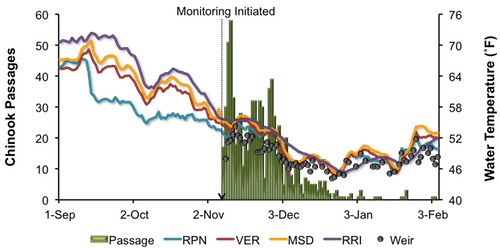
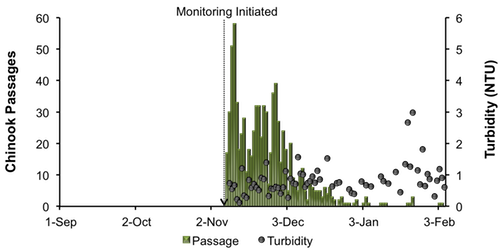
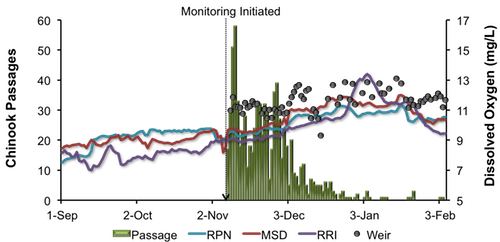
Instantaneous water temperature measured at the weir ranged between 46.9˚F and 51.8˚F, and daily average water temperature at Ripon (RPN; RM 15) ranged between 49.6˚F and 52.3˚F (Figure 8). Instantaneous turbidity ranged between 0.32 NTU and 2.98 NTU (Figure 9). Instantaneous dissolved oxygen at the weir ranged between 11.19 mg/L and 12.10 mg/L, and daily average dissolved oxygen at Ripon (RPN; RM 15) ranged from 10.18 mg/L to 10.54 mg/L (Figure 10).
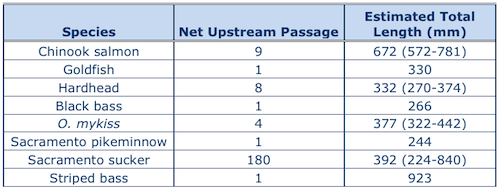
Table 7. Net passage counts for all species between January 23 and February 5, 2012 at the Stanislaus River Weir. 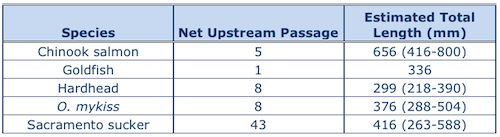 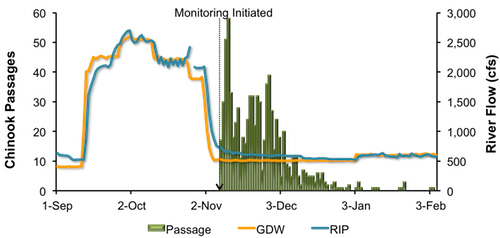 Figure 7. Daily upstream Chinook passage at the Stanislaus River weir in relation to daily average flows (cfs) recorded in the Stanislaus River at Goodwin (GDW) and Ripon (RIP), September 1, 2011 and February 5, 2012. Figure 8. Daily upstream Chinook passage recorded at the Stanislaus River weir in relation to instantaneous water temperature recorded at the weir, and daily average water temperature recorded in the Stanislaus River at Ripon (RPN), and in the San Joaquin River at Vernalis (VER), Mossdale (MSD) and Rough & Ready (RRI), September 1, 2011 and February 5, 2012.
Figure 9. Daily upstream Chinook passage at the Stanislaus River weir in relation to instantaneous turbidity recorded at the weir, September 1, 2011 and February 5, 2012.
Figure 10. Daily upstream Chinook passage at the Stanislaus River weir in relation to instantaneous dissolved oxygen recorded at the weir, and daily average dissolved oxygen recorded in the Stanislaus River at Ripon (RPN), and in the San Joaquin River at Mossdale (MSD) and Rough & Ready (RRI), September 1, 2011 and February 5, 2012.
|
2011 Tuolumne River Weir Adult Migration Monitoring
Between January 23 and February 5 a total of 9 Chinook salmon were detected by the Vaki Riverwatcher as they passed upstream of the Tuolumne River weir, increasing the season total to 2,844 (Table 8). Daily passage ranged between 0 and 3 Chinook salmon.
Daily average flow in the Tuolumne River ranged from 324 cfs to 352 cfs at La Grange (LGN; RM 50) and from 445 cfs to 589 cfs at Modesto (MOD; RM 17). Note: flows downstream of La Grange may be higher than dam releases due to accretion and Dry Creek inflow (Figure 11).
Instantaneous water temperature measured at the weir ranged from 51.4˚F and 54.8˚F and daily average water temperature at Modesto ranged from 51.1˚F and 53.4˚F (Figure 12). Instantaneous turbidity ranged between 0.44 NTU and 2.68 NTU (Figure 13), and instantaneous dissolved oxygen ranged between 10.69 mg/L and 11.90 mg/L (Figure 14).
Table 8. Net passage counts for all species between January 23 and February 5, 2012 at the Tuolumne River. 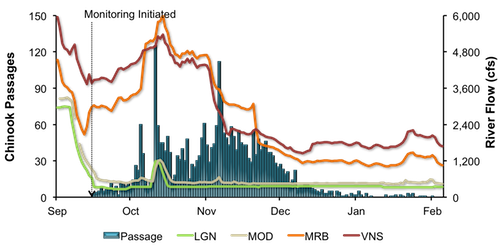
Figure 11. Daily upstream Chinook passage at the Tuolumne River weir in relation to daily average flows (cfs) recorded in the Tuolumne River at La Grange (LGN) and Modesto (MOD), and in the San Joaquin River at Maze Road Bridge (MRB) and Vernalis (VNS), September 1, 2011 and February 5, 2012. 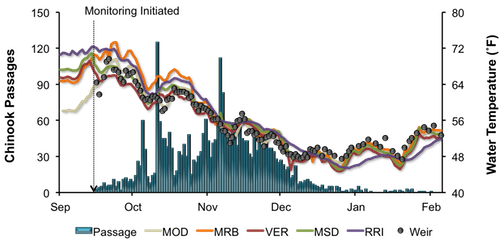
Figure 12. Daily upstream Chinook passage at the Tuolumne River weir in relation to instantaneous water temperature recorded at the weir, and daily average water temperature recorded in the Tuolumne River at Modesto (MOD) and in the San Joaquin River at Maze Road Bridge (MRB), Vernalis (VER), Mossdale (MSD) and Rough & Ready (RRI), September 1, 2011 and February 5, 2012. 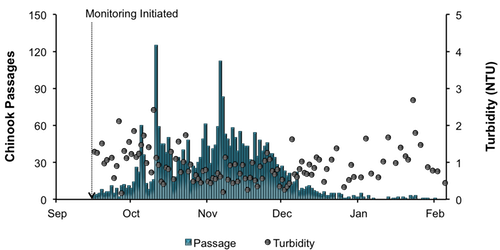
Figure 13. Daily upstream Chinook passage at the Tuolumne River weir in relation to instantaneous turbidity recorded at the weir, September 1, 2011 and February 5, 2012. 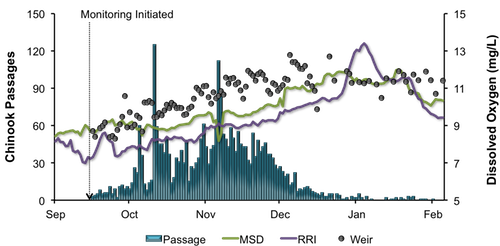
Figure 14. Daily upstream Chinook passage at the Tuolumne River weir in relation to instantaneous dissolved oxygen recorded at the weir, and daily average dissolved oxygen recorded in the San Joaquin River at Mossdale (MSD) and Rough & Ready (RRI), September 1, 2011 and February 5, 2012.
|
Mokelumne River Woodbridge Dam Fish Ladder Monitoring Fall-run Chinook salmon monitoring at Woodbridge Dam ended on January 31 and no Chinook salmon passed upstream of the dam between January 23 and January 31. The season total remains at 18,596 (Figure 15). Daily average flow in the Mokelumne River ranged from 321 cfs to 335 cfs at Camanche Reservoir (CMN) during the reporting period.
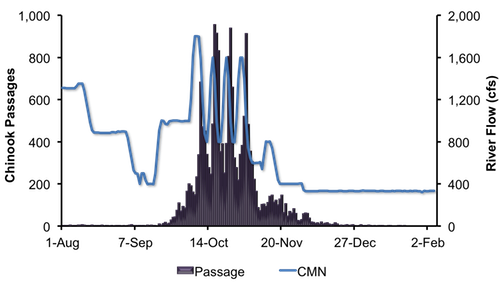
Figure 15. Daily upstream Chinook passage recorded at the Woodbridge Dam fish ladder in relation to daily average flows (cfs) recorded in the Mokelumne River at Camanche Reservoir (CMN), August 1, 2011 and February 5, 2012.
|
San Joaquin River Conditions
During the reporting period, flow in the San Joaquin River at Vernalis ranged from 1,678 cfs to 2,206 cfs (Figure 16). Water temperature in the San Joaquin River ranged from 48.8°F to 53.1°F at Vernalis, from 49.2°F to 54.3°F at Mossdale, and from 47.3°F to 52.0°F at Rough 'n Ready Island (Figure 17). Average daily dissolved oxygen (DO) in the San Joaquin River fluctuated from 10.1 mg/L to 10.8 mg/L at Mossdale, and from 9.4 mg/L to 11.4 mg/L in the deep-water ship channel (measured at Rough 'n Ready Island; Figure 18).
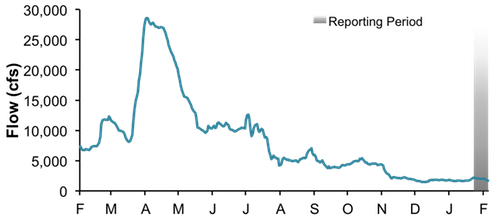
Figure 16. San Joaquin River flow at Vernalis from February 1, 2011, through February 5, 2012.
Figure 17. San Joaquin River daily average water temperature at Vernalis, Mossdale, and Rough 'n Ready from February 1, 2011, through February 5, 2012.
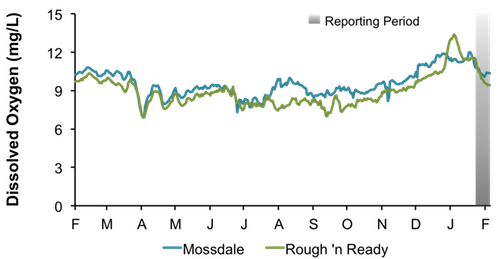
Figure 18. San Joaquin River daily average dissolved oxygen at Mossdale and Rough 'n Ready, from February 1, 2011, through February 5, 2012.
|
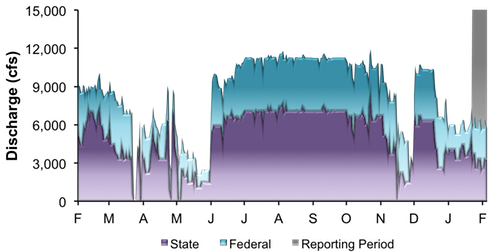
Delta ExportsMean daily pumping at the C.W. Jones Pumping Plant (federal pumps previously known as Tracy Pumping Plant) ranged from 2,395 cfs to 3,167 cfs (Figure 19). Mean daily pumping at the Harvey O. Banks Pumping Plant (state pumps) ranged from 2,506 cfs to 3,716 cfs. Combined total exports (state and federal pumps) during this period ranged from 5,666 cfs to 6,751 cfs.
Figure 19. Daily exports at the state and federal pumping stations from February 1, 2011, through February 5, 2012.
|
|
|
|
|
|
|