| Volume 2012, Issue 9 | February 1, 2012 |
|

Cal-Neva AFS Meeting:
March 28-31
Salmonid Restoration Federation Conference:
April 4-7
National Conference on Engineering & Ecohydrology for Fish Passage:
June 5-7
|
|
|
Key Highlights
January 9, 2012 - January 22, 2012
Calaveras River Juvenile Migration Monitoring continued at Shelton Road (RM 28) during the reporting period.A total of 17 O. mykiss were captured, increasing the season total to 51.
Stanislaus River Juvenile Migration Monitoring continued at Oakdale (RM 40) during the reporting period. A total of 599 Chinook salmon were captured, increasing the season total to 684.
Monitoring at Caswell State Park (RM 8) began on December 26, 2011, and a total of 5 Chinook salmon were captured through January 22, 2011.
Tuolumne River Juvenile Migration Monitoring continued at Waterford (RM 30) during the reporting period. A total of 614 Chinook salmon were captured, increasing the season total to 787. Monitoring at Grayson (RM 5) continued during the reporting period, and a total of 4 Chinook salmon were captured.
Mokelumne River Juvenile Migration Monitoring continued at Vino Farms (RM 54) during the reporting period. A total of 1,314 Chinook salmon were captured, increasing the season total to 1,491. Monitoring at Golf (RM 38) continued during the reporting period. A total of 10 Chinook salmon were captured, increasing the season total to 16.
Stanislaus River Weir Monitoring continued during the reporting period. A total of 5 Chinook salmon passed upstream through the weir between January 9 and January 26, increasing the total count since November 8th to 809.
Tuolumne River Weir Monitoring continued during the reporting period. A total of 12 Chinook salmon passed upstream through the weir between January 9 and January 26, increasing the season total to 2,835.
Mokelumne River Woodbridge Dam Fish Ladder Monitoring continued during the reporting period. A total of 4 Chinook passed upstream of the dam between January 9 and January 17, increasing the season total to 18,589.
San Joaquin Basin Escapement Surveys. Annual carcass surveys conducted by CDFG ended during the week of January 9.
San Joaquin River Conditions. San Joaquin River flow at Vernalis ranged from 1,627 cfs to 2,155 cfs. Water temperature in the San Joaquin River ranged from 45.2°F to 48.9°F at Vernalis, and from 45.9°F to 49.6°F at Mossdale. Average daily dissolved oxygen (DO) in the San Joaquin River ranged from 11.0 mg/L to 12.0 mg/L at Mossdale, and from 11.4 mg/L to 12.1 mg/L at Rough 'n Ready.
Delta Exports. Combined total exports (state and federal pumps) fluctuated during the reporting period, ranging from 5,276 cfs to 7,402 cfs.
|
|
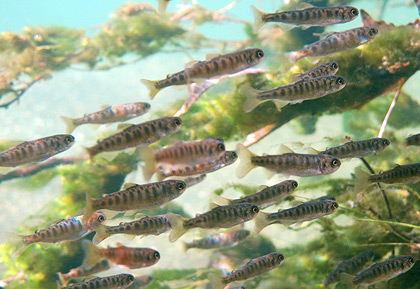
2011/12 Calaveras River Juvenile Migration Monitoring
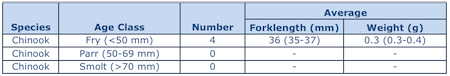
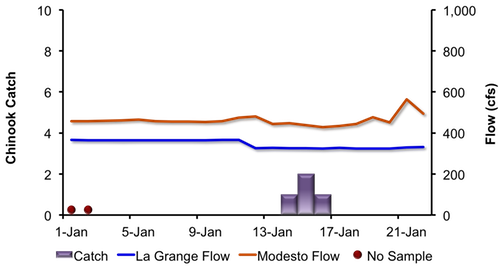
The Calaveras River rotary screw trap at Shelton Road (RM 28) sampled thirteen days between January 9 and January 22. A total of 17 O. mykiss were captured during  the reporting period, increasing the season total to 51. Daily catches ranged from zero to three individuals (Figure 1), and all of the O. mykiss captured were Age 1+ (10 the reporting period, increasing the season total to 51. Daily catches ranged from zero to three individuals (Figure 1), and all of the O. mykiss captured were Age 1+ (10
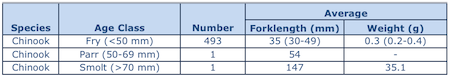
0-299 mm) and were rated as silvery parr (n=13) and smolt (n=4). Average forklengths and weights of O. mykiss are provided in Table 1.
No Chinook salmon were captured during this reporting period.
Instantaneous temperature recorded at the trap ranged from 40.6ºF to 46.9ºF, and turbidity ranged from 0.41 NTU to 2.44 NTU. During the reporting period, daily average combined flow from New Hogan Dam (NHG) and Cosgrove Creek (COS) fluctuated between 27 cfs and 78 cfs, and at Bellota (MRS) flow ranged from 19 cfs to 47 cfs.
Table 1. Biosampling data for O. mykiss captured at Shelton Road between January 9 and January 26, 2012. Parenthesis indicates range.
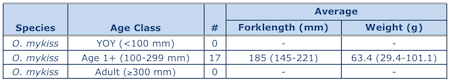 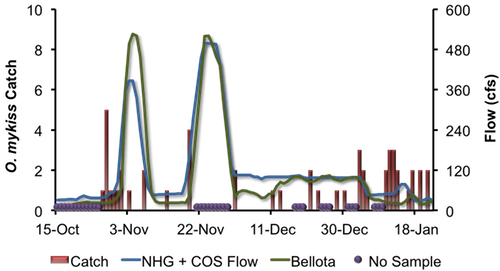
Figure 1. Daily O. mykiss catch at Shelton Road, and Calaveras River flow recorded by New Hogan Dam (NHG) and Cosgrove Creek (COS) combined and flow recorded at Bellota (MRS), in 2011 and 2012.
|
2011/12 Stanislaus River Juvenile Migration Monitoring
The Stanislaus River rotary screw trap at Oakdale (RM 40) operated continuously  between January 9 and January 22. A total of 599 Chinook salmon were captured during the reporting period, increasing the season total to 684. Daily catch ranged between 1 and 100 Chinook (Figure 2).Average forklengths and weights of all measured Chinook salmon are provided in Table 2. Most of the fish measured were fry (n=493), but one parr and one Chinook salmon greater than 100 mm were captured during the reporting period. between January 9 and January 22. A total of 599 Chinook salmon were captured during the reporting period, increasing the season total to 684. Daily catch ranged between 1 and 100 Chinook (Figure 2).Average forklengths and weights of all measured Chinook salmon are provided in Table 2. Most of the fish measured were fry (n=493), but one parr and one Chinook salmon greater than 100 mm were captured during the reporting period.
One O. mykiss was captured during the reporting period, increasing the season total to fifteen.
Instantaneous temperature taken at the trap ranged from 43.1ºF to 48.5ºF, and turbidity ranged from 0.37 NTU to 3.03 NTU. Daily average flow at Goodwin Dam (GDW) ranged from 593 cfs to 618 cfs, and flow ranged from 559 cfs to 635 cfs at Ripon (RIP) (Figure 2).
Table 2. Biosampling data for salmonids captured and measured at Oakdale between January 9 and January 22, 2012.
 Two trap efficiency experiments were conducted during the reporting period with naturally spawned juvenile Chinook salmon marked caudal fin green (CFG). The preliminary estimated capture efficiencies were 17.0% and 10.9% at a flow of 597 cfs and 595 cfs, respectively (Table 3). Table 3. Trap efficiency tests conducted at Oakdale between January 9 and January 22, 2012. 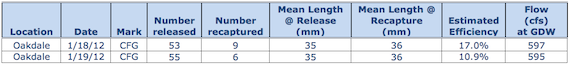 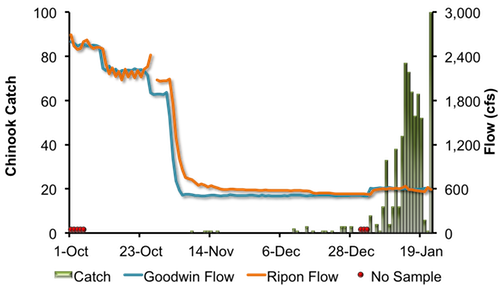 Figure 2. Daily Chinook salmon catch at Oakdale and Stanislaus River flow recorded at Goodwin Dam (GDW) and Ripon (RIP) in 2011 and 2012. The Stanislaus River rotary screw trap at Caswell State Park (RM 8) was installed December 26, 2011 and sampled through the reporting period. A total of 5 juvenile Chinook salmon have been captured so far this season. No O. mykiss have been captured so far this season. No trap efficiency experiments were conducted during the reporting period.
Instantaneous temperature recorded at the trap ranged from 43.7°F and 48.2°F, and turbidity ranged from 0.89 NTU to 3.94 NTU. Daily average flow at Ripon (RIP) ranged from 525 cfs to 635 cfs.
|
2012 Tuolumne River Juvenile Migration Monitoring
The Tuolumne River rotary screw trap at Waterford (RM 30) operated continuously during the reporting period. A total of 614 juvenile Chinook salmon were captured increasing the season total to 787. Daily catch ranged between 8 and 148 Chinook (Figure 5). Average forklengths and weights of all measured Chinook salmon are provided in Table 4. Most of the Chinook salmon captured were fry (n = 469), including two sac-fry, but parr (n = 2) and smolts (n = 2) also observed.
Table 4. Biosampling data for Chinook salmon captured and measured at Waterford between January 9 and January 22, 2012. Parentheses indicate range.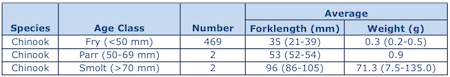 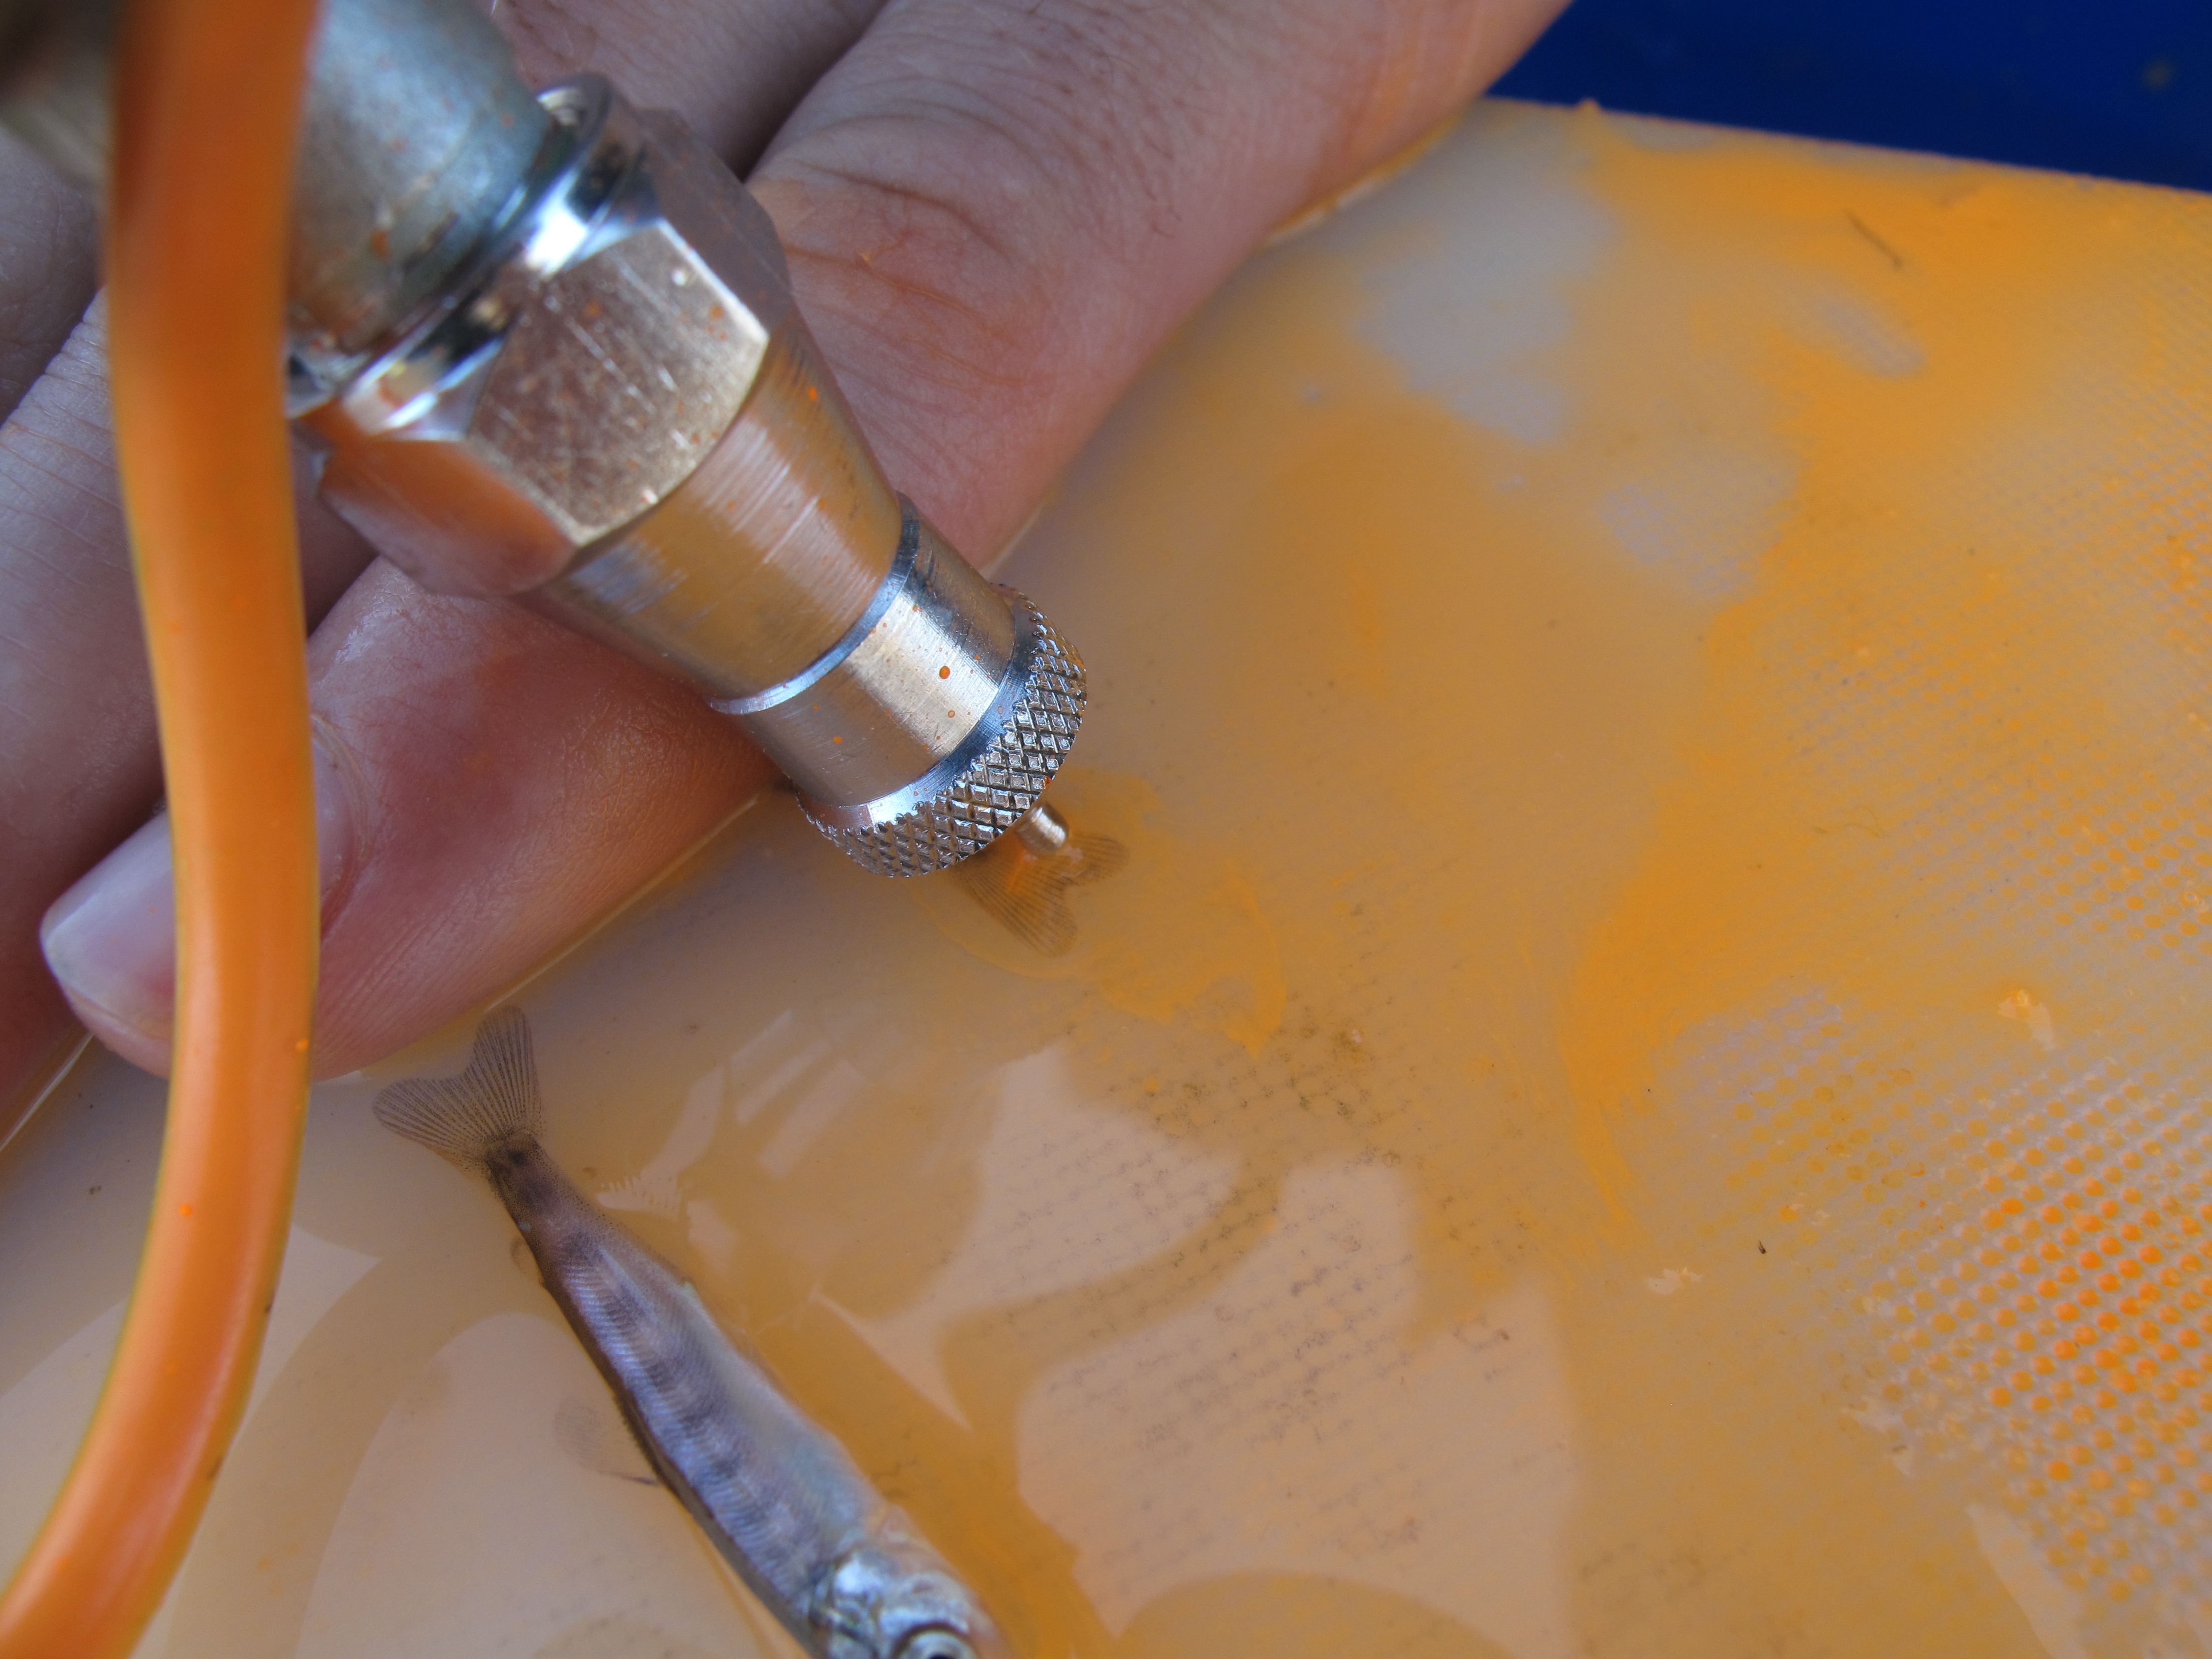 No O. mykiss were captured during this reporting period. No O. mykiss were captured during this reporting period.
Instantaneous temperature taken at the trap ranged from 45.8ºF to 51.2ºF, and turbidity ranged from 0.37 NTU to 6.92 NTU. Daily average flow at La Grange (LGN) fluctuated between 324 cfs and 366 cfs. Two trap efficiency experiments were conducted during the reporting period with naturally spawned juvenile Chinook salmon marked caudal fin orange (CFO). The preliminary estimated capture efficiencies were 13.6% and 8.0% at a flow of 366 cfs and 326 cfs, respectively (Table 5). Table 5. Trap efficiency tests conducted at Waterford between January 9 and January 22, 2012. 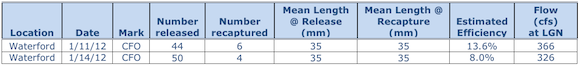 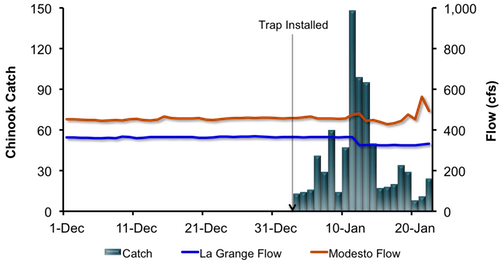 Figure 3. Daily Chinook salmon catch at Waterford and Tuolumne River flow recorded at La Grange (LGN) and Modesto (MOD) between December 1, 2011, and January 22, 2012. The Tuolumne River rotary screw traps at Grayson (RM 5) operated continuously during the reporting period and a total of 4 juvenile Chinook salmon fry were captured. Daily catch ranged between 0 and 2 Chinook (Figure 5). Average forklengths and weights of all Chinook salmon are provided in Table 6. Table 6. Biosampling data for Chinook salmon captured and measured at Waterford between January 9 and January 22, 2012. Parentheses indicate range.No O. mykiss were captured during this reporting period. Instantaneous temperature taken at the trap ranged from 45.1ºF to 51.0ºF, and turbidity ranged from 0.34 NTU to 4.68 NTU. Daily average flow at Modesto (MOD) was stable during the reporting period, ranging between 428 cfs and 564 cfs (Figure 4). No trap efficiency experiments were conducted during the reporting period.Figure 4. Daily Chinook salmon catch at Grayson and Tuolumne River flow recorded at La Grange (LGN) and Modesto (MOD) between January 1 and January 22, 2012.
|
2011/12 Mokelumne River Juvenile Migration Monitoring
The Mokelumne River rotary screw trap at Vino Farms (RM 54) was sampled intermittently. A total of 1,314 juvenile Chinook salmon were captured during the reporting period, bringing the season total to 1,491. Daily catch ranged between 22 and 340 Chinook (Figure 5).
Average daily flow from Camanche Reservoir (CMN) ranged from 331 cfs to 335 cfs (Figure 5). Instantaneous temperature ranged between 46.4°F and 49.5°F, and instantaneous turbidity ranged between 1.38 NTU and 2.39 NTU.
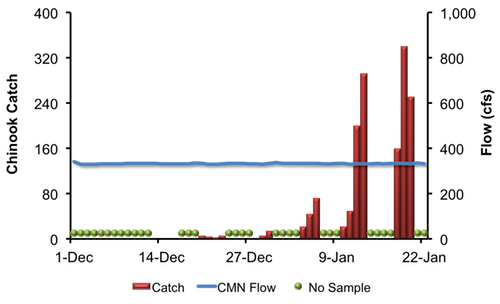 Figure 5. Daily juvenile Chinook catch at Vino Farms and Mokelumne River flow recorded at Camanche Reservoir (CMN), between December 1, 2011, and January 22, 2012.
The Mokelumne River rotary screw trap at Golf (RM 38) was sampled intermittently. A total of 10 juvenile Chinook salmon were captured during the reporting period, bringing the season total to 16. Daily catch ranged between 0 and 5 Chinook (Figure 6). Average daily flow recorded at Woodbridge (WBR) ranged from 233 cfs to 296 cfs (Figure 6). Instantaneous temperature ranged between 45.5°F and 48.0°F, and instantaneous turbidity ranged between 1.72 NTU and 2.43 NTU.
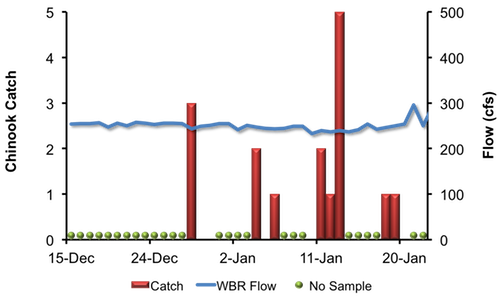
Figure 6. Daily juvenile Chinook catch at Golf and Mokelumne River flow recorded at Woodbridge (WBR), between December 15, 2011, and January 22, 2012.
|
2011 Stanislaus River Weir Adult Migration Monitoring
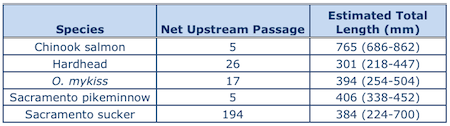
Between January 9 and January 22 the Vaki Riverwatcher detected 5 Chinook salmon as they passed upstream of the Stanislaus River Weir increasing the season total since November 8th to 809.
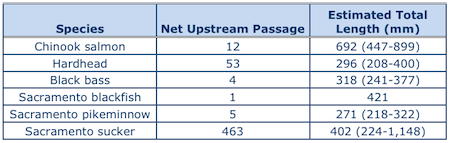
Seventeen O. mykiss (400 mm) were detected passing upstream during this reporting period increasing the season total to forty O. mykiss (Table 7). Of the 17 O. mykiss that were observed, 12 could be positively identified for presence/absence of adipose fin clip and all were of hatchery origin.
Daily average flow in the Stanislaus River at Goodwin Dam (GDW; RM 58) fluctuated between 593 cfs and 618 cfs (Figure 7). Flow at Ripon (RIP; RM 15) fluctuated between 559 cfs and 635 cfs. Note: flows downstream of Goodwin Dam may differ from dam releases due to irrigation, precipitation and other factors.
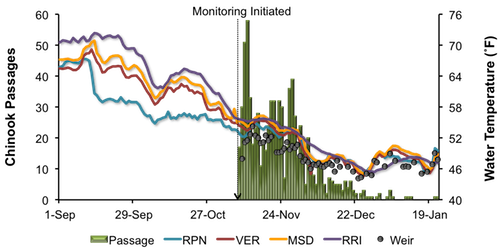
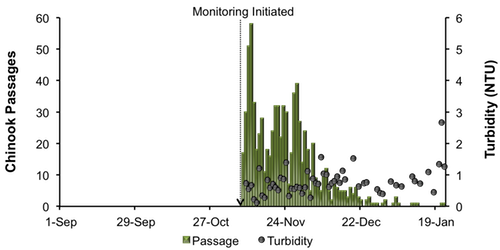
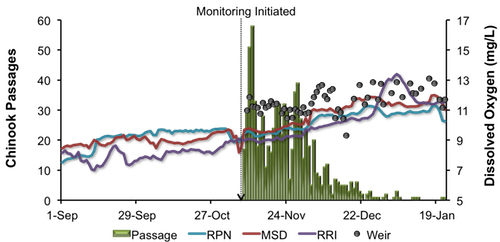
Instantaneous water temperature measured at the weir ranged between 45.1˚F and 49.1˚F, and daily average water temperature at Ripon (RPN; RM 15) ranged between 45.3˚F and 50.0˚F (Figure 8). Instantaneous turbidity ranged between 0.45 NTU and 10.80 NTU (Figure 9). Instantaneous dissolved oxygen at the weir ranged between 11.16 mg/L and 13.10 mg/L, and daily average dissolved oxygen at Ripon (RPN; RM 15) ranged from 10.24 mg/L to 11.35 mg/L (Figure 10).
Table 7. Net passage counts for all species between January 9 and January 22, 2012 at the Stanislaus River Weir.
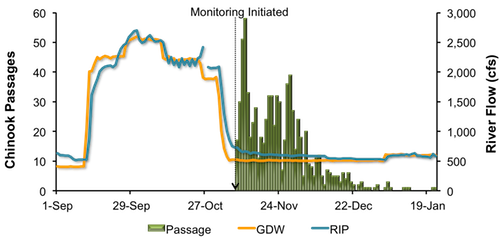 Figure 7. Daily upstream Chinook passage at the Stanislaus River weir in relation to daily average flows (cfs) recorded in the Stanislaus River at Goodwin (GDW) and Ripon (RIP), 2011 and 2012. Figure 8. Daily upstream Chinook passage recorded at the Stanislaus River weir in relation to instantaneous water temperature recorded at the weir, and daily average water temperature recorded in the Stanislaus River at Ripon (RPN), and in the San Joaquin River at Vernalis (VER), Mossdale (MSD) and Rough & Ready (RRI) in 2011 and 2012. Figure 9. Daily upstream Chinook passage at the Stanislaus River weir in relation to instantaneous turbidity recorded at the weir in 2011 and 2012. Figure 10. Daily upstream Chinook passage at the Stanislaus River weir in relation to instantaneous dissolved oxygen recorded at the weir, and daily average dissolved oxygen recorded in the Stanislaus River at Ripon (RPN), and in the San Joaquin River at Mossdale (MSD) and Rough & Ready (RRI) in 2011 and 2012.
|
2011 Tuolumne River Weir Adult Migration Monitoring
Between January 9 and January 22 a total of 12 Chinook salmon were detected by the Vaki Riverwatcher as they passed upstream of the Tuolumne River weir, increasing the season total to 2,835 (Table 8). Daily passage ranged between 0 and 3 Chinook salmon.
Daily average flow in the Tuolumne River ranged from 324 cfs to 366 cfs at La Grange (LGN; RM 50) and from 428 cfs to 564 cfs at Modesto (MOD; RM 17). Note: flows downstream of La Grange may be higher than dam releases due to accretion and Dry Creek inflow (Figure 11).
Instantaneous water temperature measured at the weir ranged from 47.4˚F and 52.1˚F and daily average water temperature at Modesto ranged from 46.4˚F and 49.6˚F (Figure 12). Instantaneous turbidity ranged between 0.60 NTU and 1.67 NTU (Figure 13), and instantaneous dissolved oxygen ranged between 10.47 mg/L and 11.92 mg/L (Figure 14).
Table 8. Net passage counts for all species between January 9 and January 22, 2012 at the Tuolumne River.
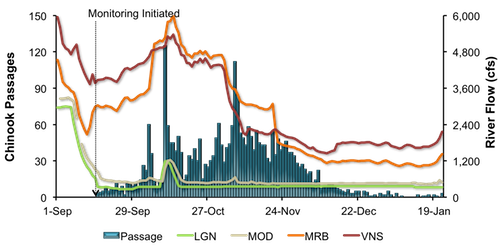
Figure 11. Daily upstream Chinook passage at the Tuolumne River Weir in relation to daily average flows (cfs) recorded in the Tuolumne River at La Grange (LGN) and Modesto (MOD), and in the San Joaquin River at Maze Road Bridge (MRB) and Vernalis (VNS) in 2011 and 2012.
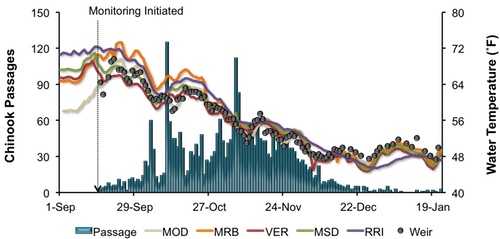
Figure 12. Daily upstream Chinook passage at the Tuolumne River Weir in relation to instantaneous water temperature recorded at the weir, and daily average water temperature recorded in the Tuolumne River at Modesto (MOD) and in the San Joaquin River at Maze Road Bridge (MRB), Vernalis (VER), Mossdale (MSD) and Rough & Ready (RRI) in 2011 and 2012.
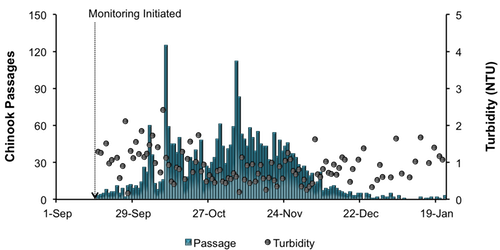
Figure 13. Daily upstream Chinook passage at the Tuolumne River Weir in relation to instantaneous turbidity recorded at the weir in 2011 and 2012.
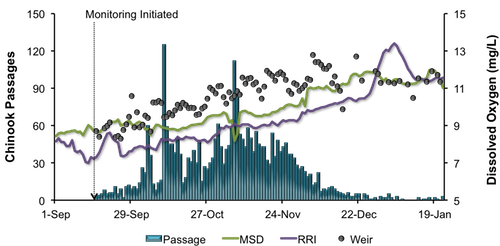
Figure 14. Daily upstream Chinook passage at the Tuolumne River Weir in relation to instantaneous dissolved oxygen recorded at the weir, and daily average dissolved oxygen recorded in the San Joaquin River at Mossdale (MSD) and Rough & Ready (RRI) in 2011 and 2012.
|
Mokelumne River Woodbridge Dam Fish Ladder Monitoring Fall-run Chinook salmon monitoring at Woodbridge Dam continued during the reporting period. A total of 4 Chinook passed upstream of the dam between January 9 and January 17, increasing the season total to 18,589 (Figure 15). Daily passage ranged between 0 and 1 Chinook salmon. Daily average flow in the Mokelumne River ranged from 331 cfs to 335 cfs at Camanche Reservoir (CMN) during the reporting period.

Figure 15. Daily upstream Chinook passage recorded at the Woodbridge Dam fish ladder in relation to daily average flows (cfs) recorded in the Mokelumne River at Camanche Reservoir (CMN), 2011 and 2012.
|
San Joaquin Basin Escapement Surveys Annual carcass surveys conducted by CDFG ended during the week of January 9. The only live fish observed during the reporting period were on the Stanislaus River, with a live count of 6.
A total of 2 redds were observed on the Merced River and 8 were recorded on the Stanislaus River, while no redds were recorded on the Tuolumne River.
A total of 73 females were spawned at the Merced River Fish Facility (MRFF) during the 2011 fall-run Chinook salmon migration.
|
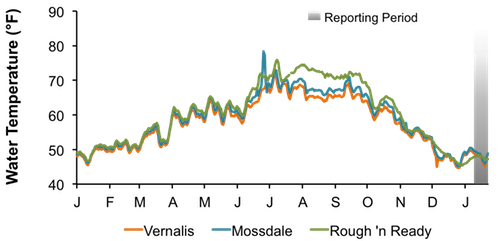
San Joaquin River Conditions During the reporting period, flow in the San Joaquin River at Vernalis ranged from 1,627 cfs to 2,155 cfs (Figure 16). Water temperature in the San Joaquin River ranged from 45.2°F to 48.9°F at Vernalis, from 45.9°F to 49.6°F at Mossdale, and from 47.1°F to 48.3°F at Rough 'n Ready Island (Figure 17). Average daily dissolved oxygen (DO) in the San Joaquin River fluctuated from 11.0 mg/L to 12.0 mg/L at Mossdale, and from 11.4 mg/L to 12.1 mg/L in the deep-water ship channel (measured at Rough 'n Ready Island; Figure 18). 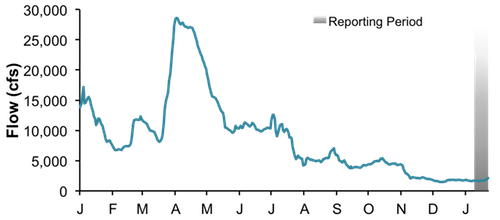
Figure 16. San Joaquin River flow at Vernalis from January 1, 2011, through January 22, 2012.
Figure 17. San Joaquin River daily average water temperature at Vernalis, Mossdale, and Rough 'n Ready from January 1, 2011, through January 22, 2012.

Figure 18. San Joaquin River daily average dissolved oxygen at Mossdale and Rough 'n Ready, from January 1, 2011, through January 22, 2012.
|
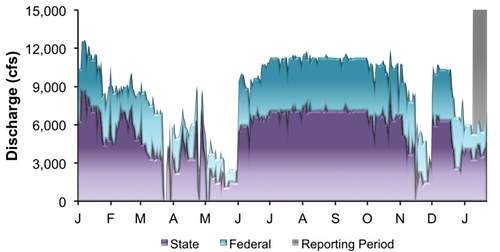
Delta Exports
Mean daily pumping at the C.W. Jones Pumping Plant (federal pumps previously known as Tracy Pumping Plant) ranged from 1,932 cfs to 2,481 cfs (Figure 19). Mean daily pumping at the Harvey O. Banks Pumping Plant (state pumps) ranged from 3,331 cfs to 4,921 cfs. Combined total exports (state and federal pumps) during this period ranged from 5,276 cfs to 7,402 cfs.
Figure 19. Daily exports at the state and federal pumping stations from January 1, 2011, through January 22, 2012.
|
|
|
|
|
|
|