| Volume 2011/12, Issue 8 | January 18, 2012 |
|

Cal-Neva AFS Meeting:
March 28-31
Salmonid Restoration Federation Conference:
April 4-7
|
|
|
Key Highlights
December 26, 2011 - January 8, 2012
Calaveras River Juvenile Migration Monitoring continued at Shelton Road (RM 28) during the reporting period.A total of 8 O. mykiss were captured, increasing the season total to 34.
Stanislaus River Juvenile Migration Monitoring continued at Oakdale (RM 40) during the reporting period. A total of 64 Chinook salmon were captured, increasing the season total to 85.
Tuolumne River Juvenile Migration Monitoring at Waterford (RM 30) began on January 2, and a total of 173 Chinook salmon fry were captured during the reporting period. Monitoring at Grayson (RM 5) began on January 2. No Chinook salmon were captured during the reporting period.
Mokelumne River Juvenile Migration Monitoring continued at Vino Farms (RM 54) during the reporting period. A total of 158 Chinook salmon were captured, increasing the season total to 177. Monitoring at Golf (RM 38) began on December 27 and a total of 6 Chinook salmon were captured during the reporting period.
Stanislaus River Weir Monitoring continued during the reporting period. A total of 11 Chinook salmon passed upstream through the weir between December 26 and January 8, increasing the total count since November 8th to 804.
Tuolumne River Weir Monitoring continued during the reporting period. A total of 22 Chinook salmon passed upstream through the weir between December 26 and January 8, increasing the season total to 2,823.
Mokelumne River Woodbridge Dam Fish Ladder Monitoring continued during the reporting period and a total of 30 Chinook passed upstream of the dam between December 26 and January 8, increasing the season total to 18,585.
San Joaquin Basin Escapement Surveys. Annual carcass surveys conducted by CDFG continued through the week of December 26.
San Joaquin River Conditions. San Joaquin River flow at Vernalis ranged from 1,611 cfs to 1,820 cfs. Water temperature in the San Joaquin River increased from 44.8°F to 49.7°F at Vernalis, and from 45.3°F to 50.5°F at Mossdale. Average daily dissolved oxygen (DO) in the San Joaquin River ranged from 11.2 mg/L to 11.9 mg/L at Mossdale, and from 10.7 mg/L to 13.4 mg/L at Rough 'n Ready.
Delta Exports. Combined total exports (state and federal pumps) fluctuated during the reporting period, ranging from 5,281 cfs to 8,083 cfs.
|
|
2011/12 Calaveras River Juvenile Migration Monitoring
The Calaveras River rotary screw trap at Shelton Road (RM 28) sampled for sixteen days between December 26 and January 8. A total of 8 O. mykiss were captured  during the reporting period, increasing the season total to 34. Daily catches ranged from zero to three individuals (Figure 1), and all of the O. mykiss captured were Age 1+ (100-299 mm) and were rated as parr (n=2), silvery parr (n=5), and smolt (n=1). Average forklengths and weights of O. mykiss are provided in Table 1. during the reporting period, increasing the season total to 34. Daily catches ranged from zero to three individuals (Figure 1), and all of the O. mykiss captured were Age 1+ (100-299 mm) and were rated as parr (n=2), silvery parr (n=5), and smolt (n=1). Average forklengths and weights of O. mykiss are provided in Table 1. No Chinook salmon were captured during this reporting period. Instantaneous temperature recorded at the trap ranged from 43.3ºF to 48.2ºF, and turbidity ranged from 0.33 NTU to 2.26 NTU. During the reporting period, daily average combined flow from New Hogan Dam (NHG) and Cosgrove Creek (COS) decreased from 99 cfs to 46 cfs, and at Bellota (MRS) flow decreased from 104 cfs and 32 cfs.
Table 1. Biosampling data for O. mykiss captured at Shelton Road between December 26 and January 8, 2011. Parenthesis indicates range.
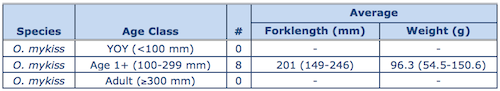 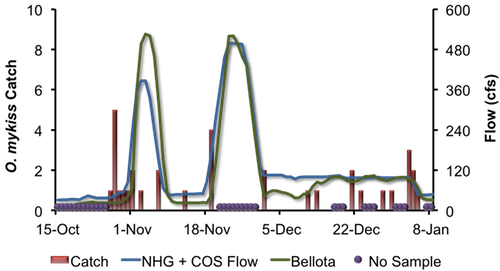
Figure 1. Daily O. mykiss catch at Shelton Road, and Calaveras River flow recorded by New Hogan Dam (NHG) and Cosgrove Creek (COS) combined and flow recorded at Bellota (MRS), in 2011 and 2012. |
2011/12 Stanislaus River Juvenile Migration Monitoring
The Stanislaus River rotary screw trap at Oakdale (RM 40) operated continuously between December 26 and January 8. A total of 64 Chinook salmon were captured  during the reporting period, increasing the season total to 85. Average forklengths and weights of all Chinook salmon are provided in Table 2. Most of the fish measured were fry (n = 63), but one captured Chinook salmon was greater than 100 mm and rated a smolt. during the reporting period, increasing the season total to 85. Average forklengths and weights of all Chinook salmon are provided in Table 2. Most of the fish measured were fry (n = 63), but one captured Chinook salmon was greater than 100 mm and rated a smolt.
No O. mykiss were captured during the reporting period. The season total remains at fourteen.
Instantaneous temperature taken at the trap ranged from 44.0ºF to 47.8ºF, and turbidity ranged from 0.19 NTU to 1.44 NTU. Daily average flow at Goodwin Dam (GDW) ranged from 505 cfs to 615 cfs, and flow ranged from 525 cfs to 601 cfs at Ripon (RIP) (Figure 2).
Table 2. Biosampling data for salmonids captured and measured at Oakdale between December 26 and January 8, 2011.
 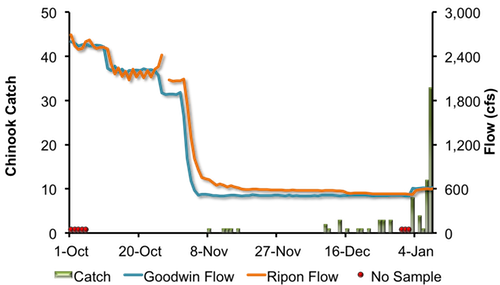 Figure 2. Daily Chinook salmon catch at Oakdale and Stanislaus River flow recorded at Goodwin Dam (GDW) and Ripon (RIP) in 2011 and 2012.
|
2012 Tuolumne River Juvenile Migration Monitoring
 The Tuolumne River rotary screw trap at Waterford (RM 30) began operating on January 2. A total of 173 juvenile Chinook salmon fry were captured. Daily catch ranged between 13 and 60 Chinook (Figure 3). Average forklengths and weights of all Chinook salmon are provided in Table 3. Most of the Chinook salmon captured were fry (n = 166), although a smolt (n = 1) was also observed. The Tuolumne River rotary screw trap at Waterford (RM 30) began operating on January 2. A total of 173 juvenile Chinook salmon fry were captured. Daily catch ranged between 13 and 60 Chinook (Figure 3). Average forklengths and weights of all Chinook salmon are provided in Table 3. Most of the Chinook salmon captured were fry (n = 166), although a smolt (n = 1) was also observed.
Table 3. Biosampling data for Chinook salmon captured and measured at Waterford between January 2 and January 8, 2012. Parentheses indicate range.
 No O. mykiss were captured during this reporting period. Instantaneous temperature taken at the trap ranged from 48.3ºF to 49.2ºF, and turbidity ranged from 0.53 NTU to 1.16 NTU. Daily average flow at La Grange (LGN) was stable between 364 cfs and 368 cfs.
One trap efficiency experiment was conducted during the reporting period with naturally spawned juvenile Chinook salmon marked caudal fin orange (CFO). The preliminary estimated capture efficiency was 21.1% at a flow of 365 cfs (Table 4).
Table 4. Trap efficiency tests conducted at Waterford between January 2 and January 8, 2012. 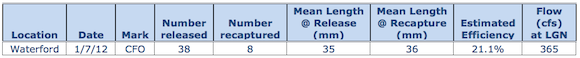 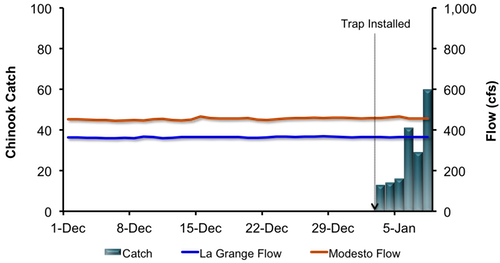 Figure 3. Daily Chinook salmon catch at Waterford and Tuolumne River flow recorded at La Grange (LGN) and Modesto (MOD) between December 1, 2011, and January 8, 2012. The Tuolumne River rotary screw traps at Grayson (RM 5) began operating on January 2. No Chinook salmon were captured during the reporting period. Instantaneous temperature taken at the trap ranged from 48.9ºF to 50.5ºF, and turbidity ranged from 0.30 NTU to 1.04 NTU. Daily average flow at Modesto (MOD) was stable during the reporting period, ranging between 456 cfs and 466 cfs.
|
2011/12 Mokelumne River Juvenile Migration Monitoring
The Mokelumne River rotary screw trap at Vino Farms (RM 54) was sampled intermittently. A total of 158 juvenile Chinook salmon were captured during the reporting period, bringing the season total to 177.
Average daily flow from Camanche Reservoir (CMN) ranged from 331 cfs to 337 cfs (Figure 4). Instantaneous temperature ranged between 48.4°F and 50.9°F, and instantaneous turbidity ranged between 1.53 NTU and 1.76 NTU.
 Figure 4. Daily juvenile Chinook catches at Vino Farms and Mokelumne River flow recorded at Camanche Reservoir (CMN), between December 1, 2011, and December 25, 2011.The Mokelumne River rotary screw trap at Golf (RM 38) was installed and intermittent monitoring began on December 27, 2011. A total of 6 juvenile Chinook salmon have been captured through the end of the reporting period.
Average daily flow recorded at Woodbridge (WBR) ranged from 241 cfs to 256 cfs (Figure 5). Instantaneous temperature ranged between 47.3°F and 49.6°F, and instantaneous turbidity ranged between 1.71 NTU and 2.56 NTU.

Figure 5. Daily juvenile Chinook catches at Golf and Mokelumne River flow recorded at Woodbridge (WBR), between December 15, 2011, and January 8, 2012.
|
2011 Stanislaus River Weir Adult Migration Monitoring
Between December 26 and January 8 the Vaki Riverwatcher detected a total of 11 Chinook salmon as they passed upstream of the Stanislaus River weir, increasing the cumulative passage since November 8th to 804 salmon (Figure 6; Table 5). Daily passage during the December 26 to January 8 sampling period ranged from 0 to 3 Chinook salmon (Figure 7).
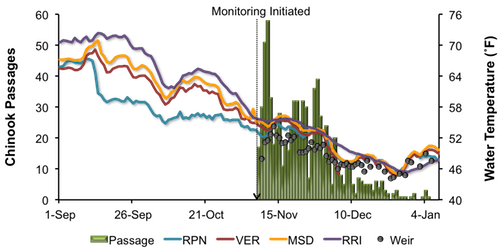
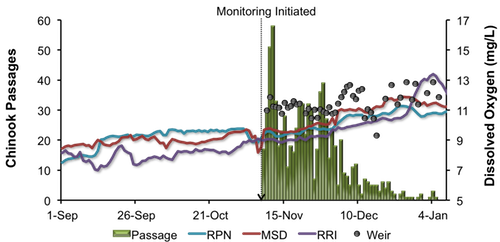
Instantaneous water temperature measured at the weir ranged from 44.8˚F to 49.0˚F, and daily average water temperature at Ripon (RPN; RM 15) ranged from 45.5˚F to 49.2˚F (Figure 8). Instantaneous turbidity ranged between 0.40 NTU and 0.79 NTU (Figure 9). Instantaneous dissolved oxygen at the weir ranged between 11.38 mg/L and 12.87 mg/L, and daily average dissolved oxygen at Ripon ranged from 10.58 mg/L to 11.25 mg/L (Figure 10).
Daily average flow in the Stanislaus River at Goodwin Dam (GDW; RM 58) increased from 505 cfs to 615 cfs. Flows at Ripon increased, from 525 cfs to 601 cfs. Note: flows downstream of Goodwin Dam may differ from dam releases due to irrigation, precipitation and other factors.
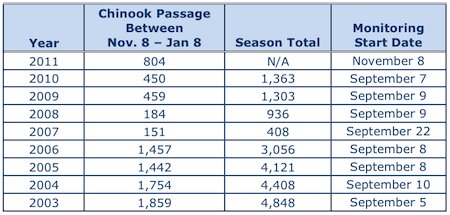
Table 5. Annual fall-run Chinook passage at the Stanislaus River weir prior to December 25, 2003-2011. Due to high flows throughout September and October, the Stanislaus River weir began sampling later than usual in 2011. Thus, the second column of Table 1 limits the inter-annual comparison to passage between November 8 and January 8.
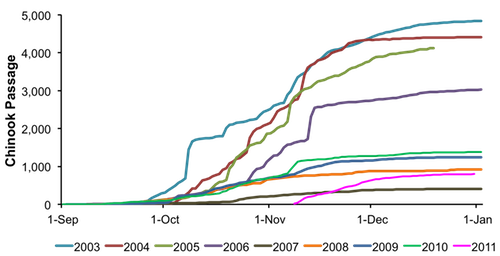
Figure 6. Cumulative passage of fall-run Chinook salmon recorded at the Stanislaus River weir from 2003-2011. Note: Monitoring did not begin in 2011 until November 8. Figure 7. Daily upstream Chinook passage at the Stanislaus River weir in relation to daily average flows (cfs) recorded in the Stanislaus River at Goodwin (GDW) and Ripon (RIP), 2011 and 2012. Figure 8. Daily upstream Chinook passage recorded at the Stanislaus River weir in relation to instantaneous water temperature recorded at the weir, and daily average water temperature recorded in the Stanislaus River at Ripon (RPN), and in the San Joaquin River at Vernalis (VER), Mossdale (MSD) and Rough & Ready (RRI) in 2011 and 2012. Figure 9. Daily upstream Chinook passage at the Stanislaus River weir in relation to instantaneous turbidity recorded at the weir in 2011 and 2012. Figure 10. Daily upstream Chinook passage at the Stanislaus River weir in relation to instantaneous dissolved oxygen recorded at the weir, and daily average dissolved oxygen recorded in the Stanislaus River at Ripon (RPN), and in the San Joaquin River at Mossdale (MSD) and Rough & Ready (RRI) in 2011 and 2012.
|
2011 Tuolumne River Weir Adult Migration Monitoring
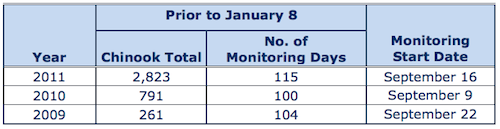
Between December 26 and January 8 a total of 22 Chinook salmon were detected by the Vaki Riverwatcher as they passed upstream of the Tuolumne River weir, increasing the season total to 2,823 (Figure 11; Table 6). Daily passage ranged between 0 and 5 Chinook salmon (Figure 12).
Daily average flow in the Tuolumne River ranged from 364 cfs to 368 cfs at La Grange (LGN; RM 50) and from 456 cfs to 466 cfs at Modesto (MOD; RM 17). Note: flows downstream of La Grange may be higher than dam releases due to accretion and Dry
Creek inflow.
Instantaneous water temperature measured at the weir ranged from 47.5˚F and 51.8˚F and daily average water temperature at Modesto ranged from 46.6˚F and 50.4˚F (Figure 13). Instantaneous turbidity ranged between 0.33 NTU and 1.64 NTU (Figure 14), and instantaneous dissolved oxygen ranged between 11.27 mg/L and 11.92 mg/L (Figure 15).
Table 6. Annual fall-run Chinook passage at the Tuolumne River weir prior to January 8, 2009 - 2011.
Figure 11. Fall-Run Chinook salmon cumulative passage recorded at the Tuolumne River weir in 2009 - 2011.

Figure 12. Daily upstream Chinook passage at the Tuolumne River Weir in relation to daily average flows (cfs) recorded in the Tuolumne River at La Grange (LGN) and Modesto (MOD), and in the San Joaquin River at Maze Road Bridge (MRB) and Vernalis (VNS) in 2011 and 2012.

Figure 13. Daily upstream Chinook passage at the Tuolumne River Weir in relation to instantaneous water temperature recorded at the weir, and daily average water temperature recorded in the Tuolumne River at Modesto (MOD) and in the San Joaquin River at Maze Road Bridge (MRB), Vernalis (VER), Mossdale (MSD) and Rough & Ready (RRI) in 2011 and 2012.
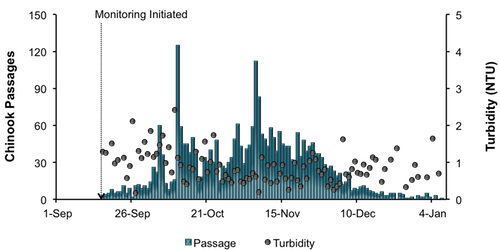
Figure 14. Daily upstream Chinook passage at the Tuolumne River Weir in relation to instantaneous turbidity recorded at the weir in 2011 and 2012.

Figure 15. Daily upstream Chinook passage at the Tuolumne River Weir in relation to instantaneous dissolved oxygen recorded at the weir, and daily average dissolved oxygen recorded in the San Joaquin River at Mossdale (MSD) and Rough & Ready (RRI) in 2011 and 2012.
|
Mokelumne River Woodbridge Dam Fish Ladder Monitoring Fall-run Chinook salmon returning to the Mokelumne River are counted annually by East Bay Municipal Utility District (EBMUD) as they ascend the fish ladder at Woodbridge Dam. During the reporting period 30 Chinook salmon were observed passing upstream of the dam, increasing the season total to 18,585 (Figure 16). Daily passage ranged between zero and six Chinook salmon. Daily average flow in the Mokelumne River ranged from 331 cfs to 337 cfs at Camanche Reservoir (CMN) during the reporting period.
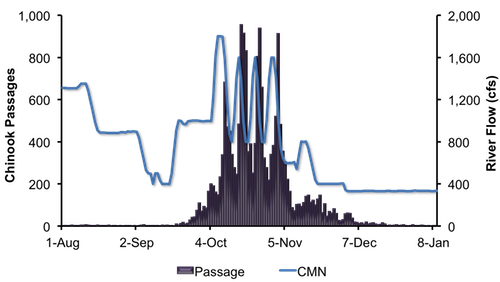
Figure 16. Daily upstream Chinook passage recorded at the Woodbridge Dam fish ladder in relation to daily average flows (cfs) recorded in the Mokelumne River at Camanche Reservoir (CMN), 2011 and 2012.
|
San Joaquin Basin Escapement Surveys Annual carcass surveys conducted by CDFG continued through the week of December 26. The largest number of live fish was observed on the Stanislaus River, with a live count of 5 Chinook during the reporting period. On both the Merced and Tuolumne rivers, peak live counts were at 3 and 2 Chinook salmon, respectively.
A total of 6 redds were observed on the Merced River and 42 were recorded on the Stanislaus River while no redds were recorded on the Tuolumne River. CDFG will continue surveys on each stream to recover tagged carcasses, but will not be tagging any new fish after January 1.
A total of 73 females were spawned at the Merced River Fish Facility (MRFF) during the 2011 fall-run Chinook salmon migration.
|
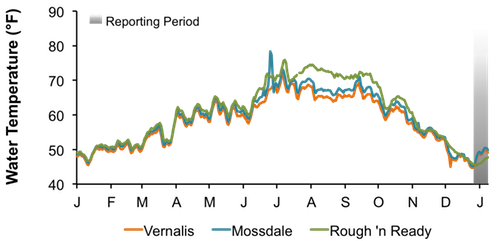
San Joaquin River Conditions During the reporting period, flow in the San Joaquin River at Vernalis ranged from 1,611 cfs to 1,820 cfs (Figure 17). Water temperature in the San Joaquin River increased from 44.8°F to 49.7°F at Vernalis, from 45.3°F to 50.5°F at Mossdale, and from 45.4°F to 47.7°F at Rough 'n Ready Island (Figure 18). Average daily dissolved oxygen (DO) in the San Joaquin River fluctuated from 11.2 mg/L to 11.9 mg/L at Mossdale, and from 10.7 mg/L to 13.4 mg/L in the deep-water ship channel (measured at Rough 'n Ready Island; Figure 19). 
Figure 17. San Joaquin River flow at Vernalis from January 1, 2011, through January 8, 2012.
Figure 18. San Joaquin River daily average water temperature at Vernalis, Mossdale, and Rough 'n Ready from January 1, 2011, through January 8, 2012.
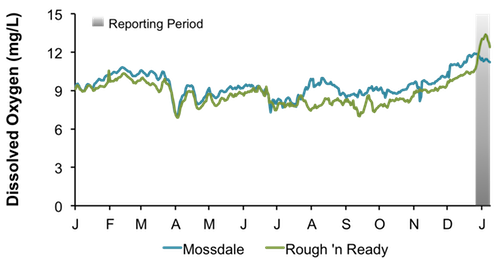
Figure 19. San Joaquin River daily average dissolved oxygen at Mossdale and Rough 'n Ready, from January 1, 2011, through January 8, 2012.
|
Delta Exports
Mean daily pumping at the C.W. Jones Pumping Plant (federal pumps previously known as Tracy Pumping Plant) ranged from 1,950 cfs to 4,010 cfs (Figure 20). Mean daily pumping at the Harvey O. Banks Pumping Plant (state pumps) ranged from 2,413 cfs to 4,082 cfs. Combined total exports (state and federal pumps) during this period ranged from 5,281 cfs to 8,083 cfs.
Figure 20. Daily exports at the state and federal pumping stations from January 1, 2011, through January 8, 2012.
|
|
|
|
|
|
|