| Volume 2011, Issue 6 | December 13, 2011 |
|

Cal-Neva AFS Meeting:
March 28-31
Salmonid Restoration Federation Conference:
April 4-7
|
|

Photo by FISHBIO |
Key Highlights
November 14 - December 4, 2011
Stanislaus River Weir Monitoring continued during the reporting period. A total of 475 Chinook salmon passed upstream through the weir between November 14 and December 4, increasing the total count since November 8th to 682.
Tuolumne River Weir Monitoring continued during the reporting period. A total of 763 Chinook salmon passed upstream through the weir between November 14 and December 4, increasing the season total to 2,646.
Mokelumne River Woodbridge Dam Fish Ladder Monitoring continued during the reporting period and a total of 1,680 Chinook passed upstream of the dam between November 14 and December 4, increasing the season total to 18,348.
Calaveras River Juvenile Migration Monitoring continued at Shelton Road (RM 28) during the reporting period.A total of 6 O. mykiss were captured increasing the season total to 21.
Stanislaus River Juvenile Migration Monitoring continued at Oakdale (RM 40) during the reporting period. A total of 2 Chinook salmon were captured increasing the season total to 5.
San Joaquin River Conditions. San Joaquin River flow at Vernalis decreased from 2,243 cfs to 1,613 cfs. Water temperature in the San Joaquin River decreased from 55.5°F to 48.0°F at Vernalis, and from 56.3°F to 49.1°F at Mossdale. Average daily dissolved oxygen (DO) in the San Joaquin River ranged from 9.5 mg/L to 11.0 mg/L at Mossdale, and from 8.9 mg/L to 9.8 mg/L at Rough 'n Ready.
Delta Exports.Combined total exports (state and federal pumps) fluctuated during the reporting period, ranging from 2,319 cfs to 10,638 cfs.
|
|
2011 Stanislaus River Weir Adult Migration Monitoring
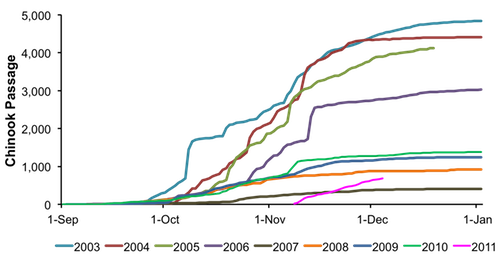
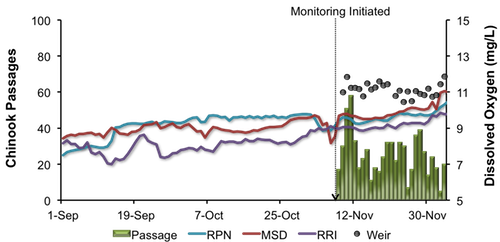
Between November 14 and December 4 the Vaki Riverwatcher detected a total of 475 fall-run Chinook salmon as they passed upstream of the Stanislaus River weir, 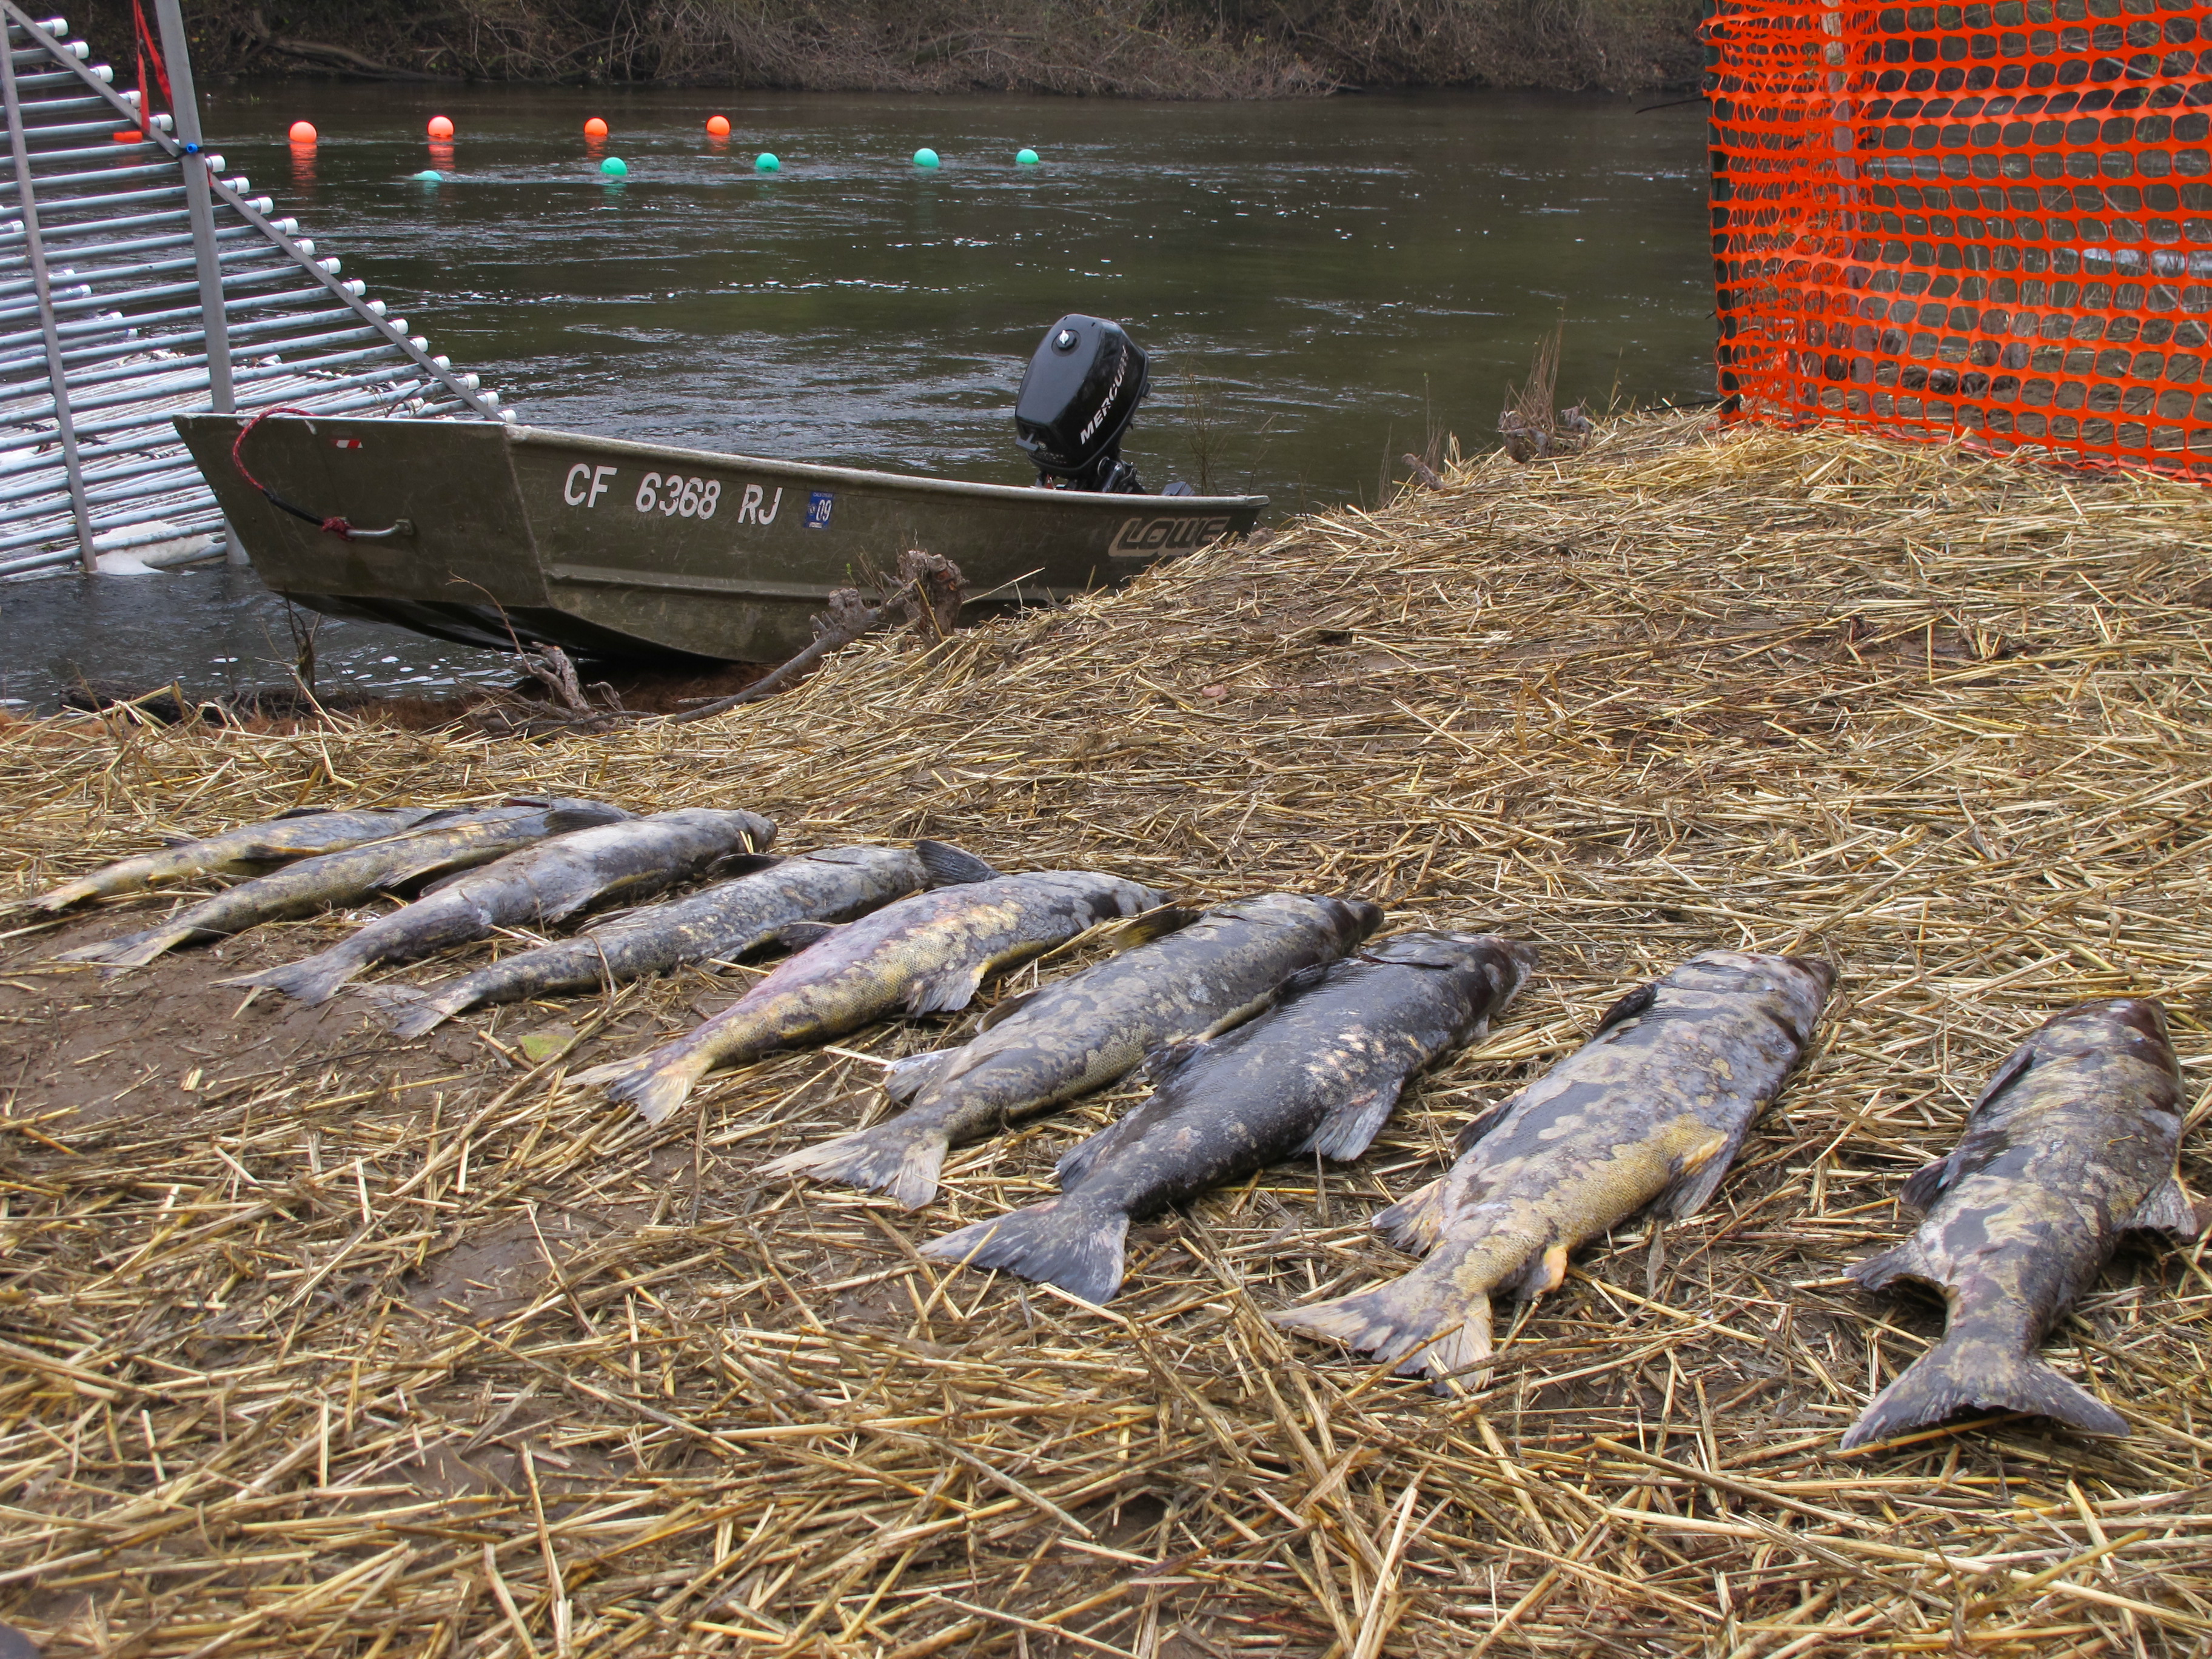 increasing the cumulative passage since November 8th to 682 salmon (Figure 1; Table 1). Daily passage during the November 14 to December 4 sampling period ranged from 5 to 39 Chinook salmon (Figure 2). Due to high flows throughout September and October, the Stanislaus River weir began sampling later than usual in 2011. Thus, the second column of Table 1 limits the inter-annual comparison to passage between November 8th and December 4th. increasing the cumulative passage since November 8th to 682 salmon (Figure 1; Table 1). Daily passage during the November 14 to December 4 sampling period ranged from 5 to 39 Chinook salmon (Figure 2). Due to high flows throughout September and October, the Stanislaus River weir began sampling later than usual in 2011. Thus, the second column of Table 1 limits the inter-annual comparison to passage between November 8th and December 4th.
Instantaneous water temperature measured at the weir decreased from 52.5˚F to 47.3˚F, and daily average water temperature at Ripon (RPN; RM 15) decreased from 54.9˚F to 49.0˚F (Figure 3). Instantaneous turbidity ranged between 0.28 NTU and 1.39 NTU (Figure 4). Instantaneous dissolved oxygen at the weir ranged between 10.46 mg/L and 11.86 mg/L, and daily average dissolved oxygen at Ripon ranged from 9.28 mg/L to 10.32 mg/L (Figure 5).
Daily average flows in the Stanislaus River at Goodwin Dam (GDW; RM 58) ranged from 503 cfs to 520 cfs. Flows at Ripon ranged from 582 cfs to 645 cfs. Note: flows downstream of Goodwin Dam may differ from dam releases due to irrigation, precipitation and other factors.
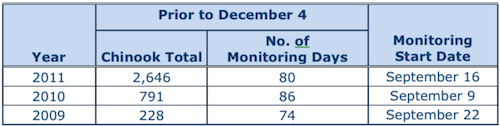
Table 1. Annual fall-run Chinook passage at the Stanislaus River weir prior to December 4, 2003-2011.
Figure 1. Cumulative passage of fall-run Chinook salmon recorded at the Stanislaus River weir from 2003-2011. Figure 2. Daily upstream Chinook passage at the Stanislaus River weir in relation to daily average flows (cfs) recorded in the Stanislaus River at Goodwin (GDW) and Ripon (RIP), 2011. Figure 3. Daily upstream Chinook passage recorded at the Stanislaus River weir in relation to instantaneous water temperature recorded at the weir, and daily average water temperature recorded in the Stanislaus River at Ripon (RPN), and in the San Joaquin River at Vernalis (VER), Mossdale (MSD) and Rough & Ready (RRI) in 2011. Figure 4. Daily upstream Chinook passage at the Stanislaus River weir in relation to instantaneous turbidity recorded at the weir in 2011. Figure 5. Daily upstream Chinook passage at the Stanislaus River weir in relation to instantaneous dissolved oxygen recorded at the weir, and daily average dissolved oxygen recorded in the Stanislaus River at Ripon (RPN), and in the San Joaquin River at Mossdale (MSD) and Rough & Ready (RRI) in 2011.
|
2011 Tuolumne River Weir Adult Migration Monitoring
Between November 14 and December 4 a total of 763 Chinook salmon were detected by the Vaki Riverwatcher as they passed upstream of the Tuolumne River weir, increasing the season total to 2,646 (Figure 6; Table 2). Daily passage ranged between 19 and 55 Chinook salmon (Figure 7).
Daily average flow in the Tuolumne River ranged from 325 cfs to 367 cfs at La Grange (LGN; RM 50) and from 440 cfs to 473 cfs at Modesto (MOD; RM 17; Figure 4). Note: flows downstream of La Grange may be higher than dam releases due to accretion and Dry Creek inflow.
Instantaneous water temperature measured at the weir decreased from 57.5˚F and 48.5˚F and daily average water temperature at Modesto decreased from 55.6˚F and 47.8˚F (Figure 8). Instantaneous turbidity ranged between 0.26 NTU and 1.26 NTU (Figure 9), and instantaneous dissolved oxygen ranged between 10.43 mg/L and 11.93 mg/L (Figure 10).
Table 2. Annual fall-run Chinook passage at the Tuolumne River weir prior to December 4, 2009 - 2011.
Figure 6. Fall-Run Chinook salmon cumulative passage recorded at the Tuolumne River weir in 2009 - 2011.
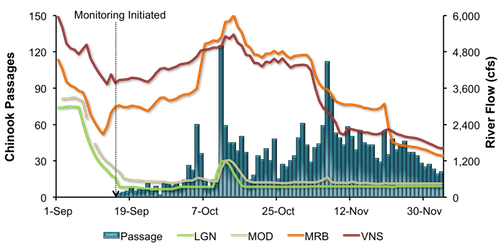
Figure 7. Daily upstream Chinook passage at the Tuolumne River Weir in relation to daily average flows (cfs) recorded in the Tuolumne River at La Grange (LGN) and Modesto (MOD), and in the San Joaquin River at Maze Road Bridge (MRB) and Vernalis (VNS) in 2011.

Figure 8. Daily upstream Chinook passage at the Tuolumne River Weir in relation to instantaneous water temperature recorded at the weir, and daily average water temperature recorded in the Tuolumne River at Modesto (MOD) and in the San Joaquin River at Maze Road Bridge (MRB), Vernalis (VER), Mossdale (MSD) and Rough & Ready (RRI) in 2011.

Figure 9. Daily upstream Chinook passage at the Tuolumne River Weir in relation to instantaneous turbidity recorded at the weir in 2011.
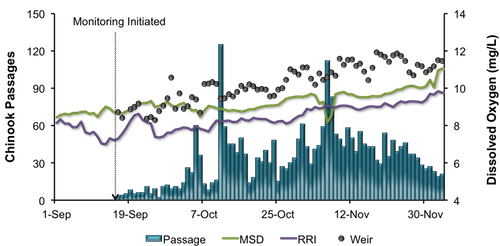
Figure 10. Daily upstream Chinook passage at the Tuolumne River Weir in relation to instantaneous dissolved oxygen recorded at the weir, and daily average dissolved oxygen recorded in the San Joaquin River at Mossdale (MSD) and Rough & Ready (RRI) in 2011.
|
Mokelumne River Woodbridge Dam Fish Ladder Monitoring Fall-run Chinook salmon returning to the Mokelumne River are counted annually by East Bay Municipal Utility District (EBMUD) as they ascend the fish ladder at Woodbridge Dam. During the reporting period 1,680 Chinook salmon were observed passing upstream of the dam, increasing the season total to 18,348 (Figure 11). Daily passage ranged between 24 and 147 Chinook salmon. Daily average flow in the Mokelumne River decreased from 801 cfs to 330 cfs at Camanche Reservoir (CMN) during the reporting period.
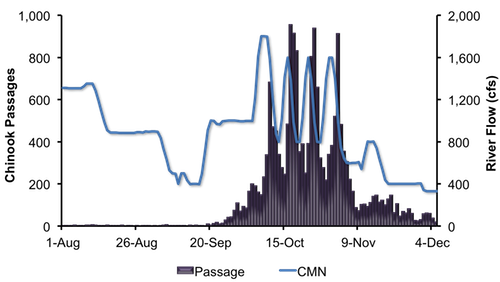
Figure 11. Daily upstream Chinook passage recorded at the Woodbridge Dam fish ladder in relation to daily average flows (cfs) recorded in the Mokelumne River at Camanche Reservoir (CMN), 2011.
|
San Joaquin Basin Escapement Surveys Annual carcass surveys conducted by CDFG continued through the week of November 28. The largest number of live fish was observed on the Stanislaus River, with a live count of 236 Chinook during the reporting period. Peak live counts on the Merced and Tuolumne rivers were 111 and 77, respectively.
A total of 58 redds were observed on the Merced River, 75 on the Tuolumne River, and 224 were recorded on the Stanislaus River. The decrease in the number of redds observed since the last newsletter indicates that the fall-run spawning season is past the peak.
A total of 68 females have been spawned at the Merced River Fish Facility (MRFF) as of December 4.
|
2011 Calaveras River Juvenile Migration Monitoring
The Calaveras River rotary screw trap at Shelton Road (RM 28) sampled for twelve 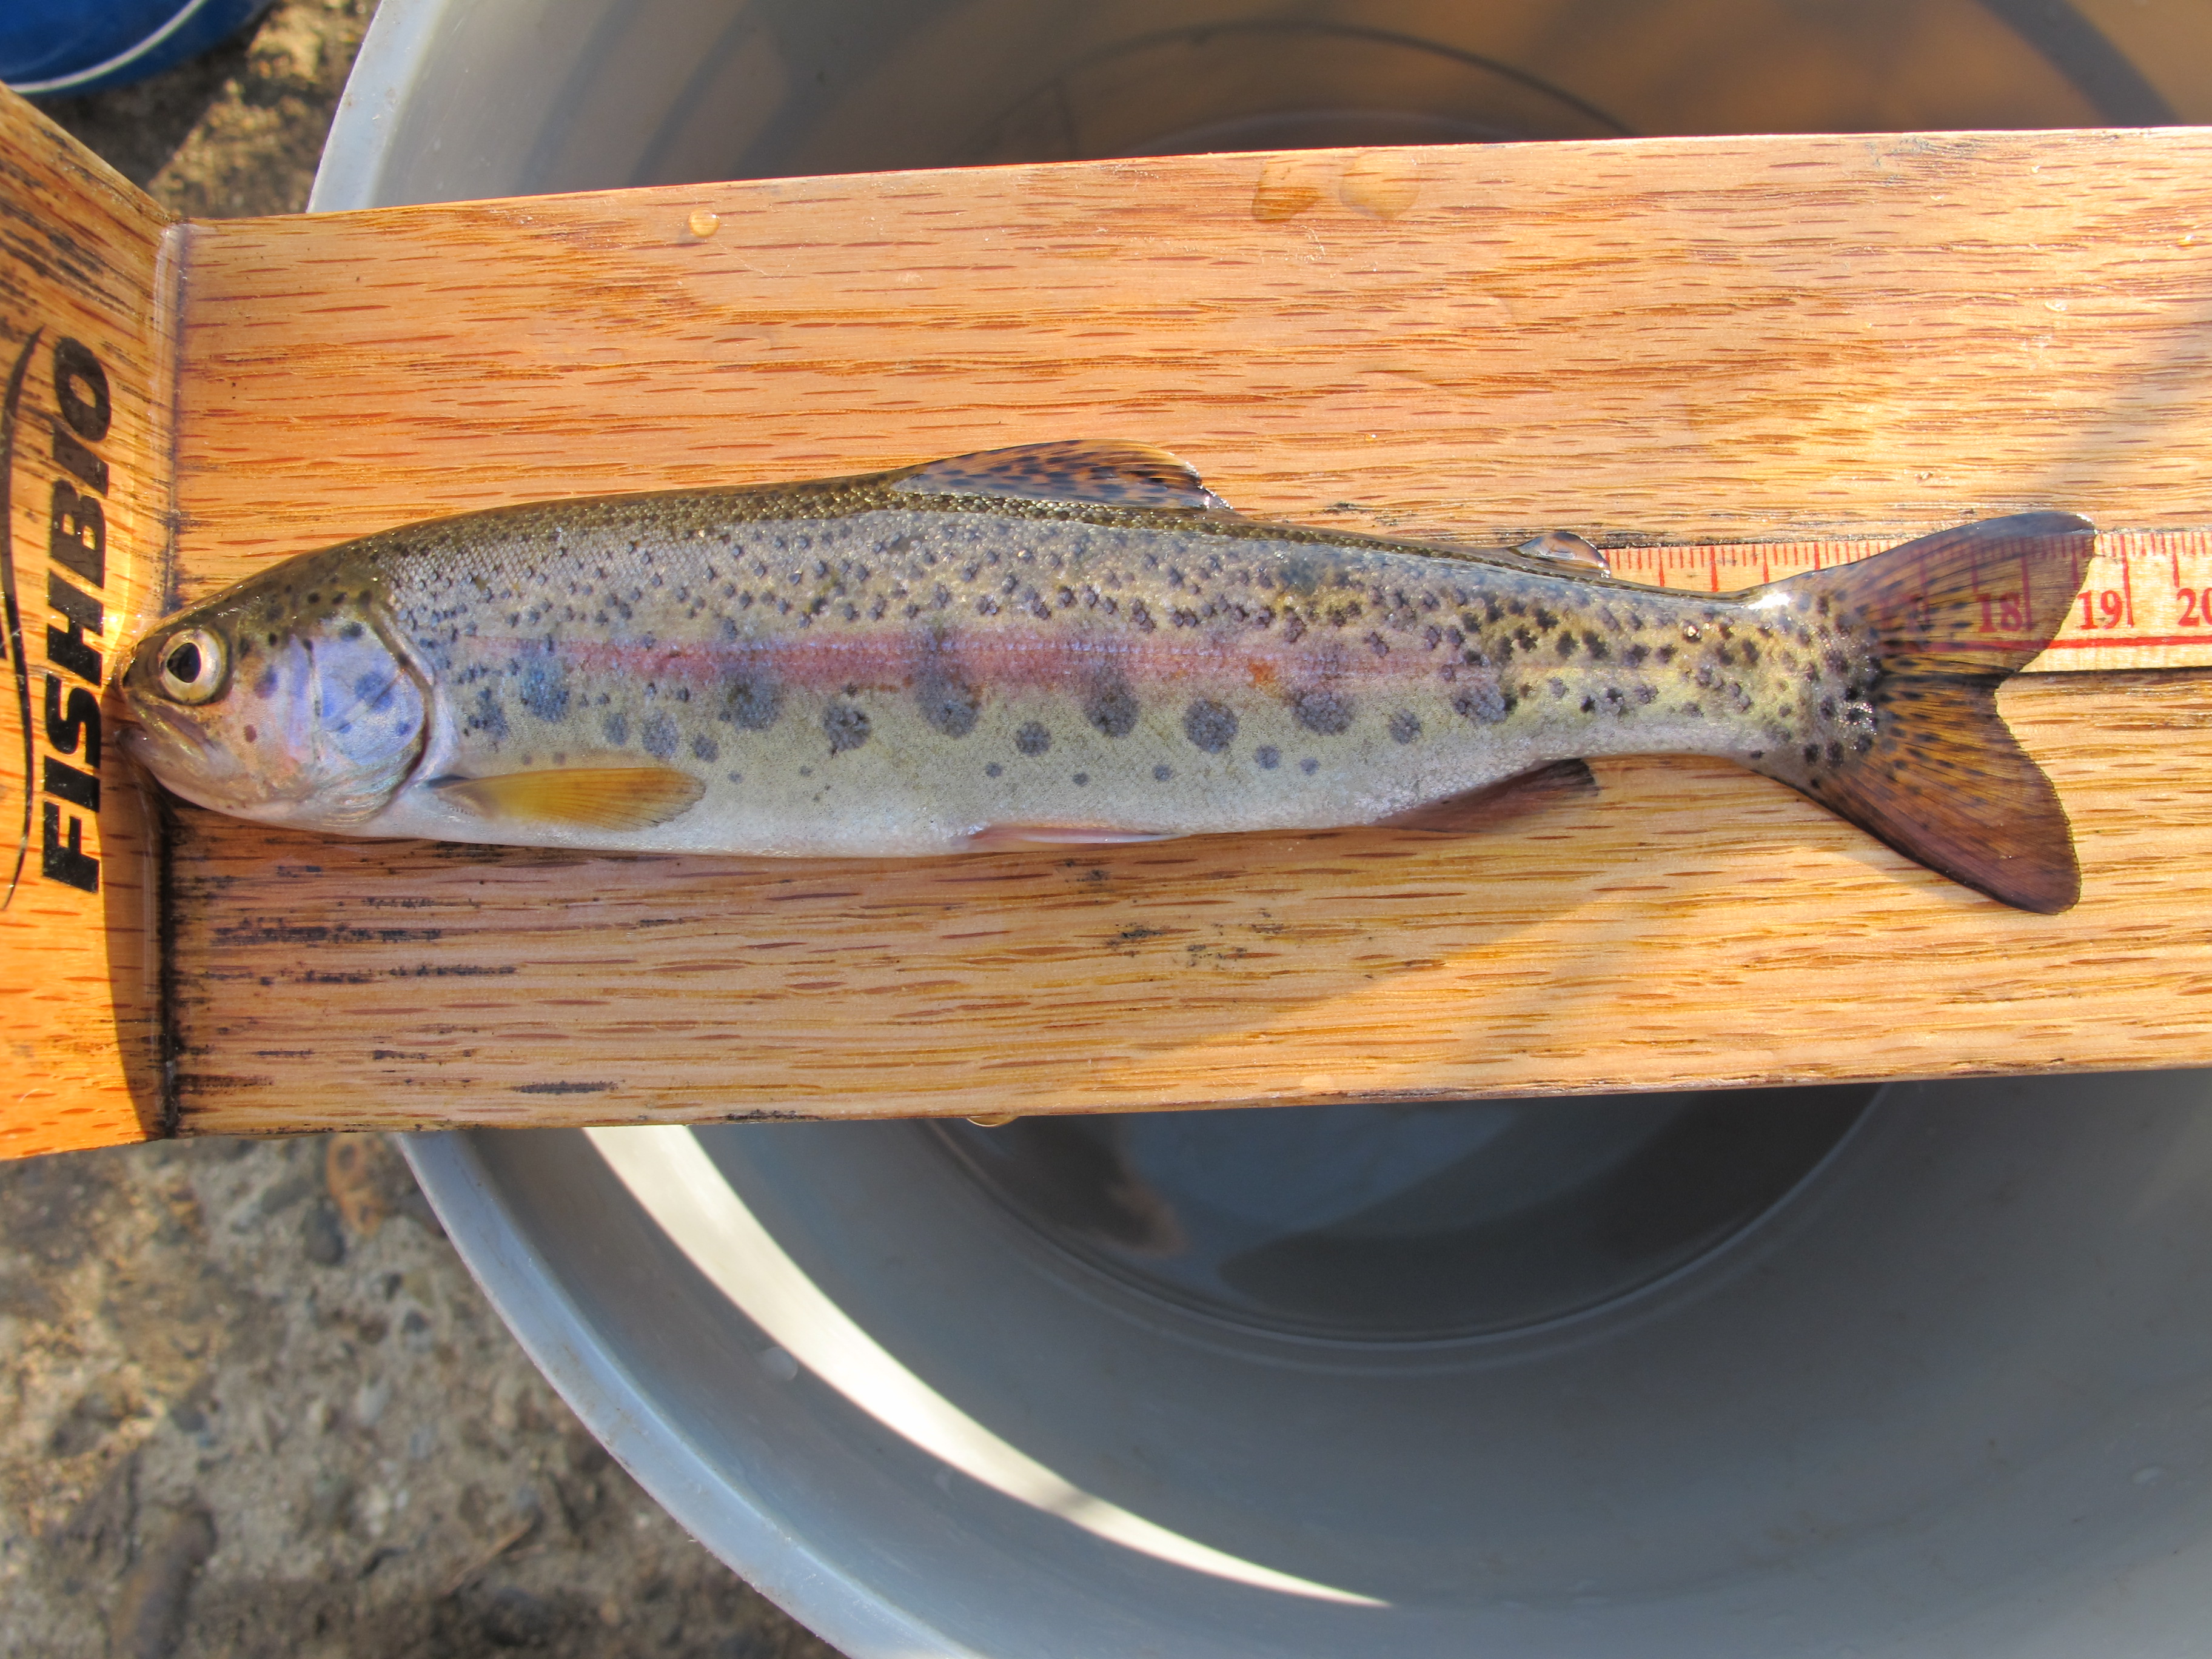 days between November 14 and December 4. A total of six O. mykiss were captured during the reporting period, increasing the season total to twenty-one. Daily catches ranged from zero to four individuals (Figure 12), and all O. mykiss captured were Age 1+ (100-299 mm) and were rated as silvery parr (n=4). Average forklengths and weights of O. mykiss are provided in Table 3. days between November 14 and December 4. A total of six O. mykiss were captured during the reporting period, increasing the season total to twenty-one. Daily catches ranged from zero to four individuals (Figure 12), and all O. mykiss captured were Age 1+ (100-299 mm) and were rated as silvery parr (n=4). Average forklengths and weights of O. mykiss are provided in Table 3.
No Chinook salmon were captured during this reporting period.
Instantaneous temperature recorded at the trap ranged from 46.9ºF to 53.6ºF, and turbidity ranged from 0.18 NTU to 1.62 NTU. During the reporting period, daily average combined flow from New Hogan Dam (NHG) and Cosgrove Creek (COS) ranged from 49 cfs up to 499 cfs, and at Bellota (MRS) flow fluctuated between 23 cfs and 521 cfs.
Table 3. Biosampling data for O. mykiss captured at Shelton Road between November 14 and December 4, 2011. Parenthesis indicates range.

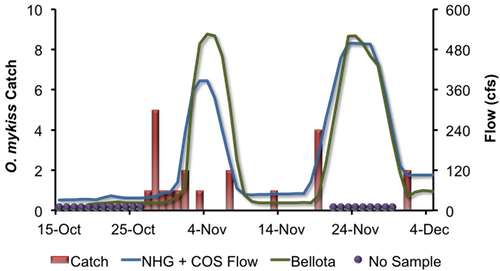
Figure 12. Daily O. mykiss catch at Shelton Road, and Calaveras River flow recorded by New Hogan Dam (NHG) and Cosgrove Creek (COS) combined and flow recorded at Bellota (MRS), in 2011.
|
2011 Stanislaus River Juvenile Migration Monitoring
The Stanislaus River rotary screw trap at Oakdale (RM 40) operated continuously 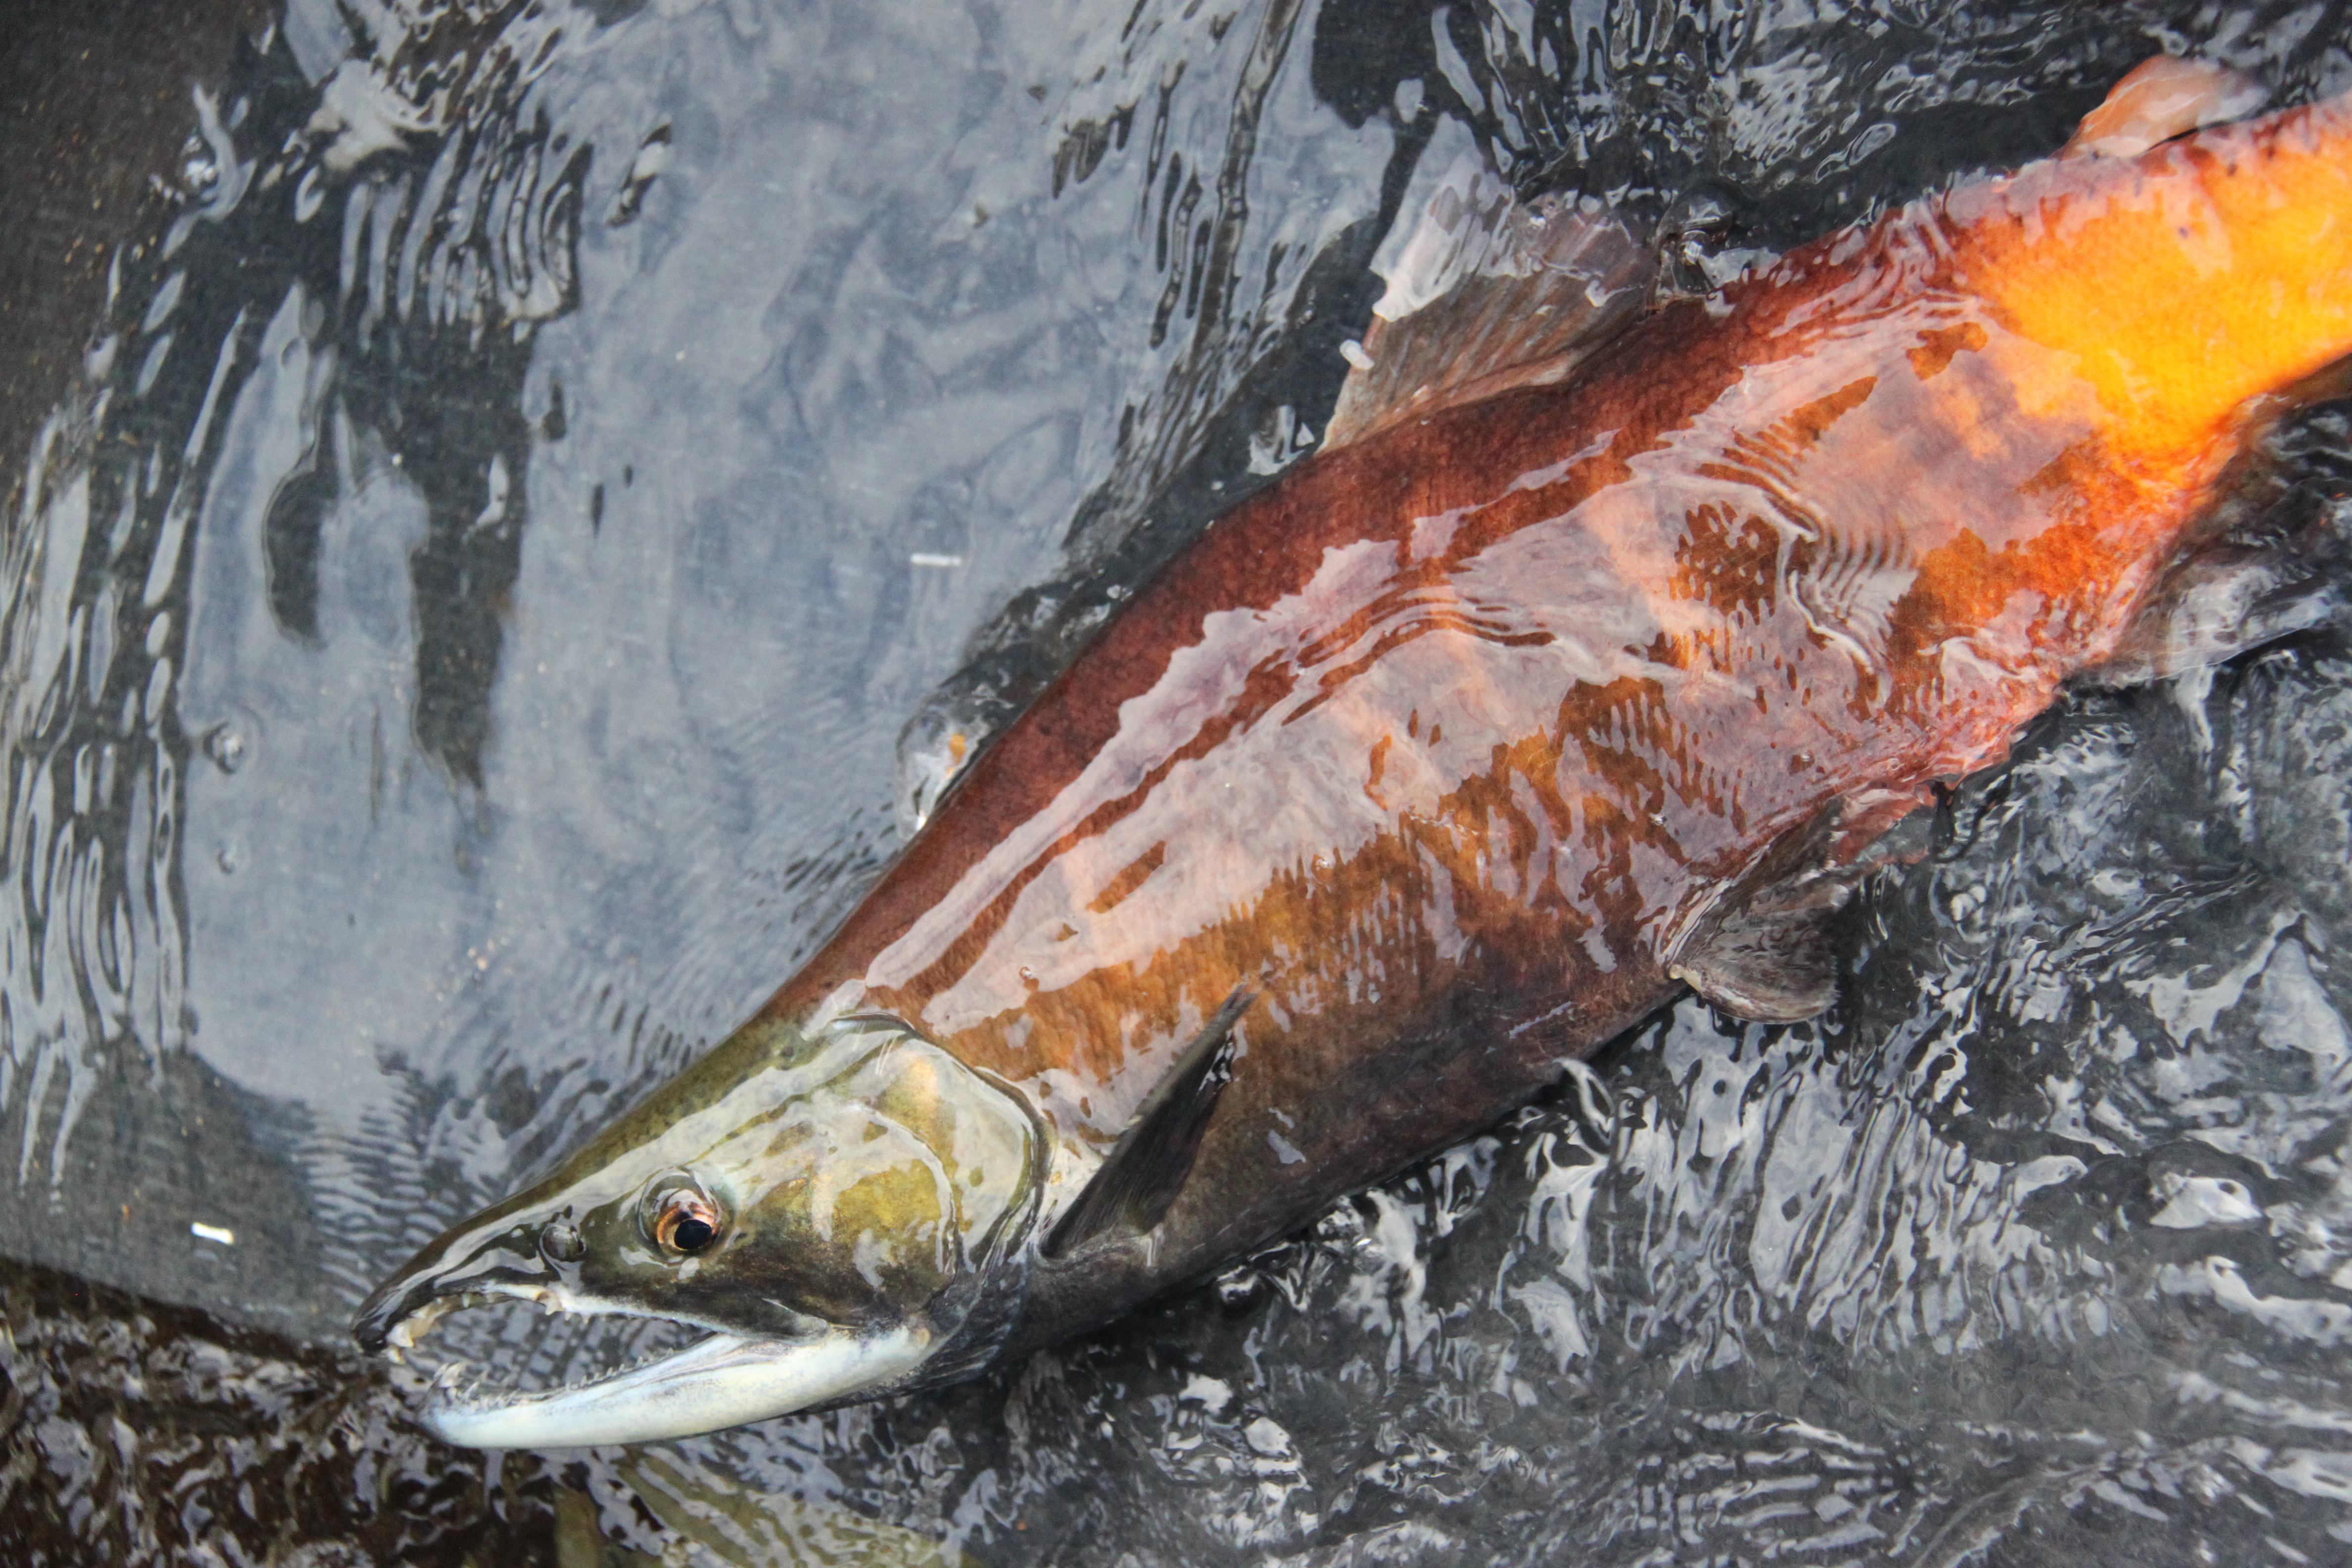 between November 14 and December 4. A total of two Chinook salmon were captured during the reporting period, increasing the season total to five. Both Chinook salmon that were captured were greater than 135 mm and rated as smolts. A variety of other fish species were captured, including a rare adult male sockeye salmon, Tule perch (n=34), Sacramento sucker (n=25), and prickly sculpin (n=13) (Table 4). between November 14 and December 4. A total of two Chinook salmon were captured during the reporting period, increasing the season total to five. Both Chinook salmon that were captured were greater than 135 mm and rated as smolts. A variety of other fish species were captured, including a rare adult male sockeye salmon, Tule perch (n=34), Sacramento sucker (n=25), and prickly sculpin (n=13) (Table 4).
Eight O. mykiss were captured during the reporting period increasing the season total to ten.
Instantaneous temperature taken at the trap ranged from 47.1ºF to 51.4ºF, and turbidity ranged from 0.26 NTU to 2.94 NTU. Daily average flow at Goodwin Dam (GDW) ranged from 503 cfs to 520 cfs, and from 579 cfs to 645 cfs flows at Ripon (RIP) (Figure 13).
Table 4. Biosampling data for all species captured and measured at Oakdale between November 14 and December 4, 2011.
  Figure 13. Daily Chinook salmon catch at Oakdale and Stanislaus River flow recorded at Goodwin Dam (GDW) and Ripon (RIP) in 2011.
|
San Joaquin River Conditions
During the reporting period, flow in the San Joaquin River at Vernalis decreased from 2,243 cfs to 1,613 cfs (Figure 14). Water temperature in the San Joaquin River decreased from 55.5°F to 48.0°F at Vernalis, from 56.3°F to 49.1°F at Mossdale, and from 55.8°F to 51.1°F at Rough 'n Ready Island (Figure 15). Average daily dissolved oxygen (DO) in the San Joaquin River fluctuated from 9.5 mg/L to 11.0 mg/L at Mossdale, and from 8.9 mg/L to 9.8 mg/L in the deep-water ship channel (measured at Rough 'n Ready Island; Figure 16).
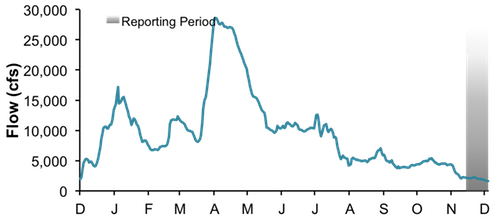
Figure 14. San Joaquin River flow at Vernalis from December 1, 2010, through December 4, 2011.
Figure 15. San Joaquin River daily average water temperature at Vernalis, Mossdale, and Rough 'n Ready from December 1, 2010, through December 4, 2011.

Figure 16. San Joaquin River daily average dissolved oxygen at Mossdale and Rough 'n Ready, from December 1, 2010, through December 4, 2011.
|
|
Delta Exports
Mean daily pumping at the C.W. Jones Pumping Plant (federal pumps previously known as Tracy Pumping Plant) ranged from 0 cfs to 4,102 cfs (Figure 17). Mean daily pumping at the Harvey O. Banks Pumping Plant (state pumps) ranged from 1,188 cfs to 6,608 cfs. Combined total exports (state and federal pumps) during this period ranged from 2,319 cfs to 10,638 cfs.
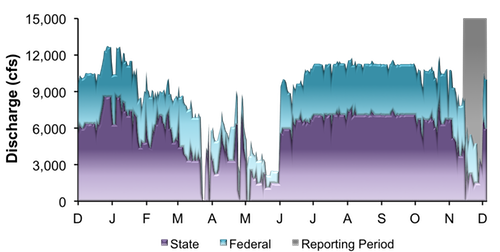
Figure 17. Daily exports at the state and federal pumping stations from December 1, 2010, through December 4, 2011.
|
|
|
|
|
|
|