| Volume 2011, Issue 4 | November 8, 2011 |
|

International Congress for Conservation Biology:
December 6-9
|
|
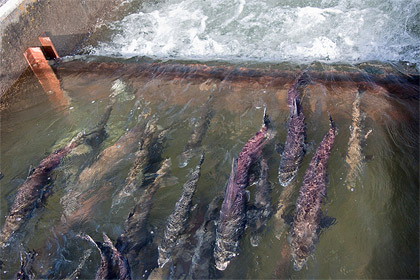
Photo by FISHBIO |
Key Highlights
October 17 - October 30, 2011
Stanislaus River Weir Monitoring continues to be delayed by high flow releases from New Melones Reservoir which will be reduced to 500 cfs on November 4. The weir is scheduled to be installed during the week of November 7.
Tuolumne River Weir Monitoring continued during the reporting period. A total of 433 Chinook salmon passed upstream through the weir between October 17 and October 30, increasing the season total to 1,120.
Mokelumne River Woodbridge Dam Fish Ladder Monitoring continued during the reporting period and a total of 7,646 Chinook passed upstream of the dam between October 17 and October 30, increasing the season total to 12,758.
San Joaquin Basin Escapement Surveys. Annual carcass surveys conducted by California Department of Fish and Game (CDFG) continued through the week of October 24.
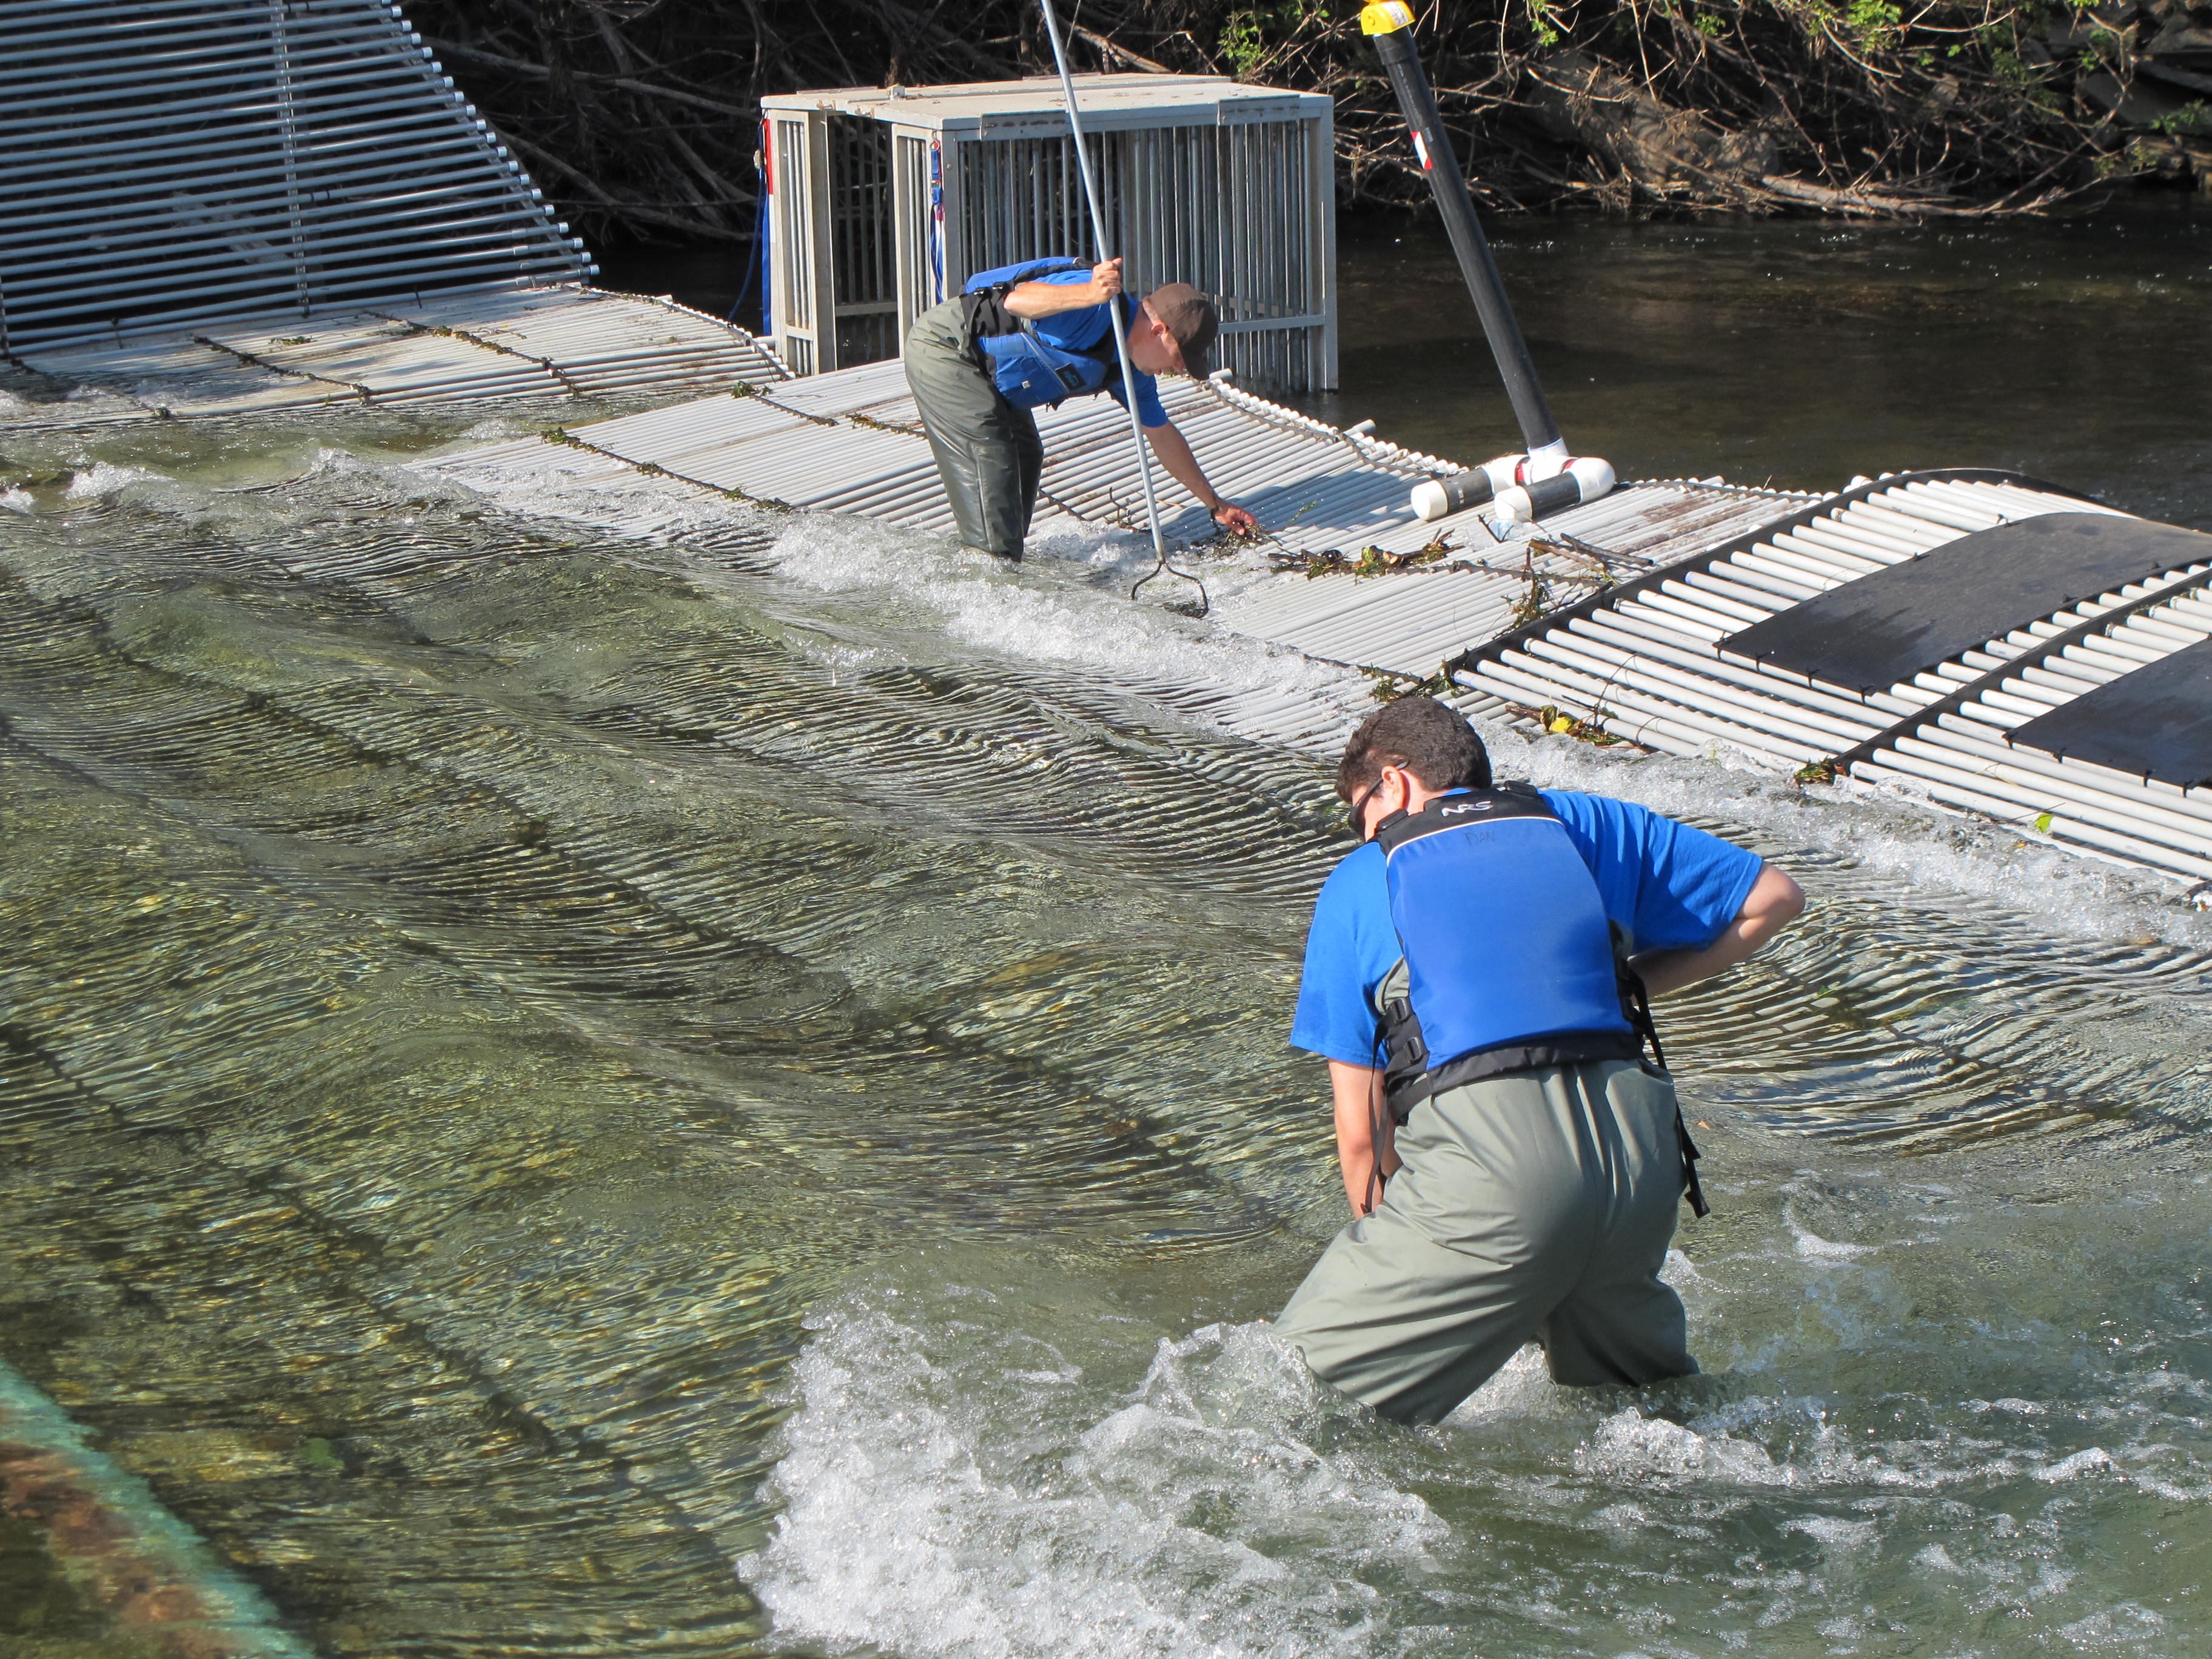
Calaveras River Juvenile Migration Monitoring at the Shelton Road (RM 28) rotary screw trap was initiated on October 27. A total of eight O. mykiss were captured during the reporting period.
Stanislaus River Juvenile Migration Monitoring continued at Oakdale (RM 40) during the reporting period.
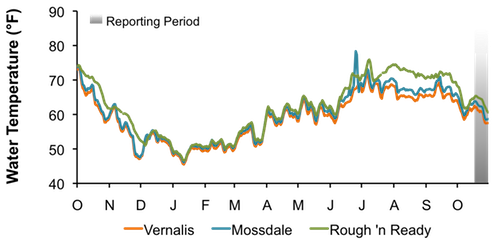
San Joaquin River Conditions San Joaquin River flow at Vernalis fluctuated from 4,280 cfs to 4,700 cfs. Water temperature in the San Joaquin River decreased from 62.5°F to 57.4°F at Vernalis, and from 63.8°F to 58.4°F at Mossdale. Average daily dissolved oxygen (DO) in the San Joaquin River ranged from 8.8 mg/L to 9.6 mg/L at Mossdale, and from 8.1 mg/L to 8.5 mg/L at Rough 'n Ready.
Delta ExportsCombined total exports (state and federal pumps) fluctuated during the reporting period, ranging from 9,609 cfs to 11,903 cfs.
|
|
|
2011 Stanislaus River Weir Adult Migration Monitoring
Flows on the Stanislaus River have fluctuated between 1,882 cfs and 2,233 cfs at Goodwin Dam (GDW) but will be reduced to 500 cfs by November 4. The weir will be installed during the week of November 7.
|
2011 Tuolumne River Weir Adult Migration Monitoring
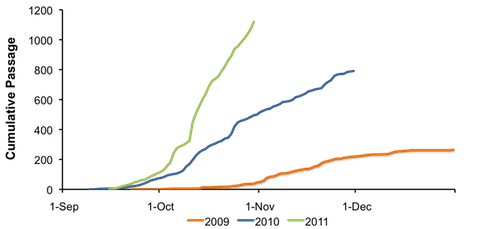
 Between October 17 and October 30 a total of 433 Chinook salmon were detected by the Vaki Riverwatcher as they passed upstream of the Tuolumne River weir, increasing the season total to 1,120 (Figure 1; Table 1). Daily passage ranged between 15 and 49 Chinook. Between October 17 and October 30 a total of 433 Chinook salmon were detected by the Vaki Riverwatcher as they passed upstream of the Tuolumne River weir, increasing the season total to 1,120 (Figure 1; Table 1). Daily passage ranged between 15 and 49 Chinook.
Daily average flow in the Tuolumne River ranged from 337 cfs to 343 cfs at La Grange (LGN; RM 50) and from 461 cfs to 579 cfs at Modesto (MOD; RM 17; Figure 2). Note: flows downstream of La Grange may be higher than dam releases due to accretion and Dry Creek inflow. Instantaneous water temperature measured at the weir ranged between 58.2˚F and 63.1˚F and daily average water temperature at Modesto ranged between 58.1˚F and 63.5˚F (Figure 3). Instantaneous turbidity ranged between 0.45 NTU and 1.74 NTU (Figure 4), and instantaneous dissolved oxygen ranged between 9.56 mg/L and 11.11 mg/L (Figure 5).
Table 1. Annual Fall-run Chinook passage at the Tuolumne River weir prior to October 30, 2009 - 2011.
Figure 1. Fall-Run Chinook salmon cumulative passage recorded at the Tuolumne River weir in 2009 - 2011.
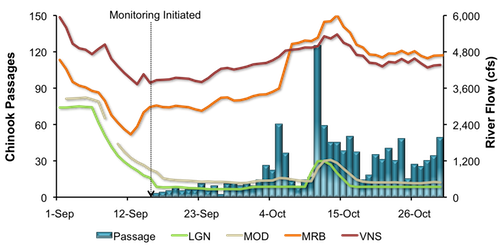
Figure 2. Daily upstream Chinook passage at the Tuolumne River Weir in relation to daily average flows (cfs) recorded in the Tuolumne River at La Grange (LGN) and Modesto (MOD), and in the San Joaquin River at Maze Road Bridge (MRB) and Vernalis (VNS) in 2011. (Note: The change in flow at MRB is an adjustment of the rating curve.)
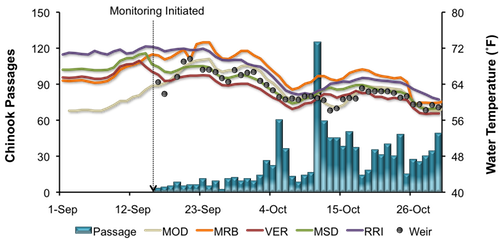
Figure 3. Daily upstream Chinook passage at the Tuolumne River Weir in relation to instantaneous water temperature recorded at the weir, and daily average water temperature recorded in the Tuolumne River at Modesto (MOD) and in the San Joaquin River at Maze Road Bridge (MRB), Vernalis (VER), Mossdale (MSD) and Rough & Ready (RRI) in 2011.
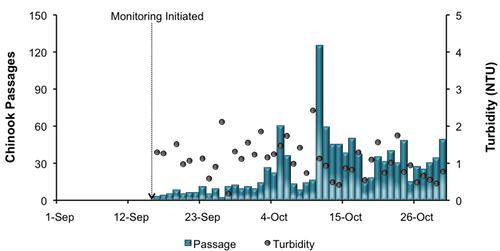
Figure 4. Daily upstream Chinook passage at the Tuolumne River Weir in relation to instantaneous turbidity recorded at the weir in 2011.

Figure 5. Daily upstream Chinook passage at the Tuolumne River Weir in relation to instantaneous dissolved oxygen recorded at the weir, and daily average dissolved oxygen recorded in the San Joaquin River at Mossdale (MSD) and Rough & Ready (RRI) in 2011.
|
Mokelumne River Woodbridge Dam Fish Ladder Monitoring Fall-run Chinook salmon returning to the Mokelumne River are counted annually by East Bay Municipal Utility District (EBMUD) as they ascend the fish ladder at Woodbridge Dam. During the reporting period 7,646 Chinook salmon were observed passing upstream of the dam, increasing the season total to 12,758 (Figure 6). Daily passage ranged between 218 and 955 Chinook. During the reporting period, daily average flow in the Mokelumne River fluctuated between 795 and 1,598 cfs at Camanche Reservoir (CMN). 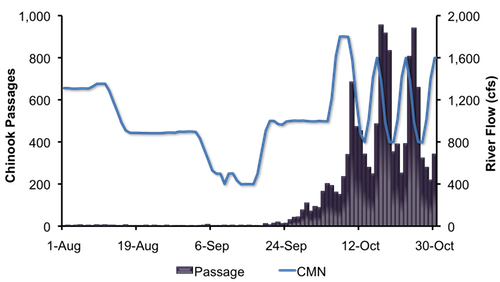
Figure 6. Daily upstream Chinook passage recorded at the Woodbridge Dam fish ladder in relation to daily average flows (cfs) recorded in the Mokelumne River at Camanche Reservoir (CMN), 2011.
|
San Joaquin Basin Escapement Surveys 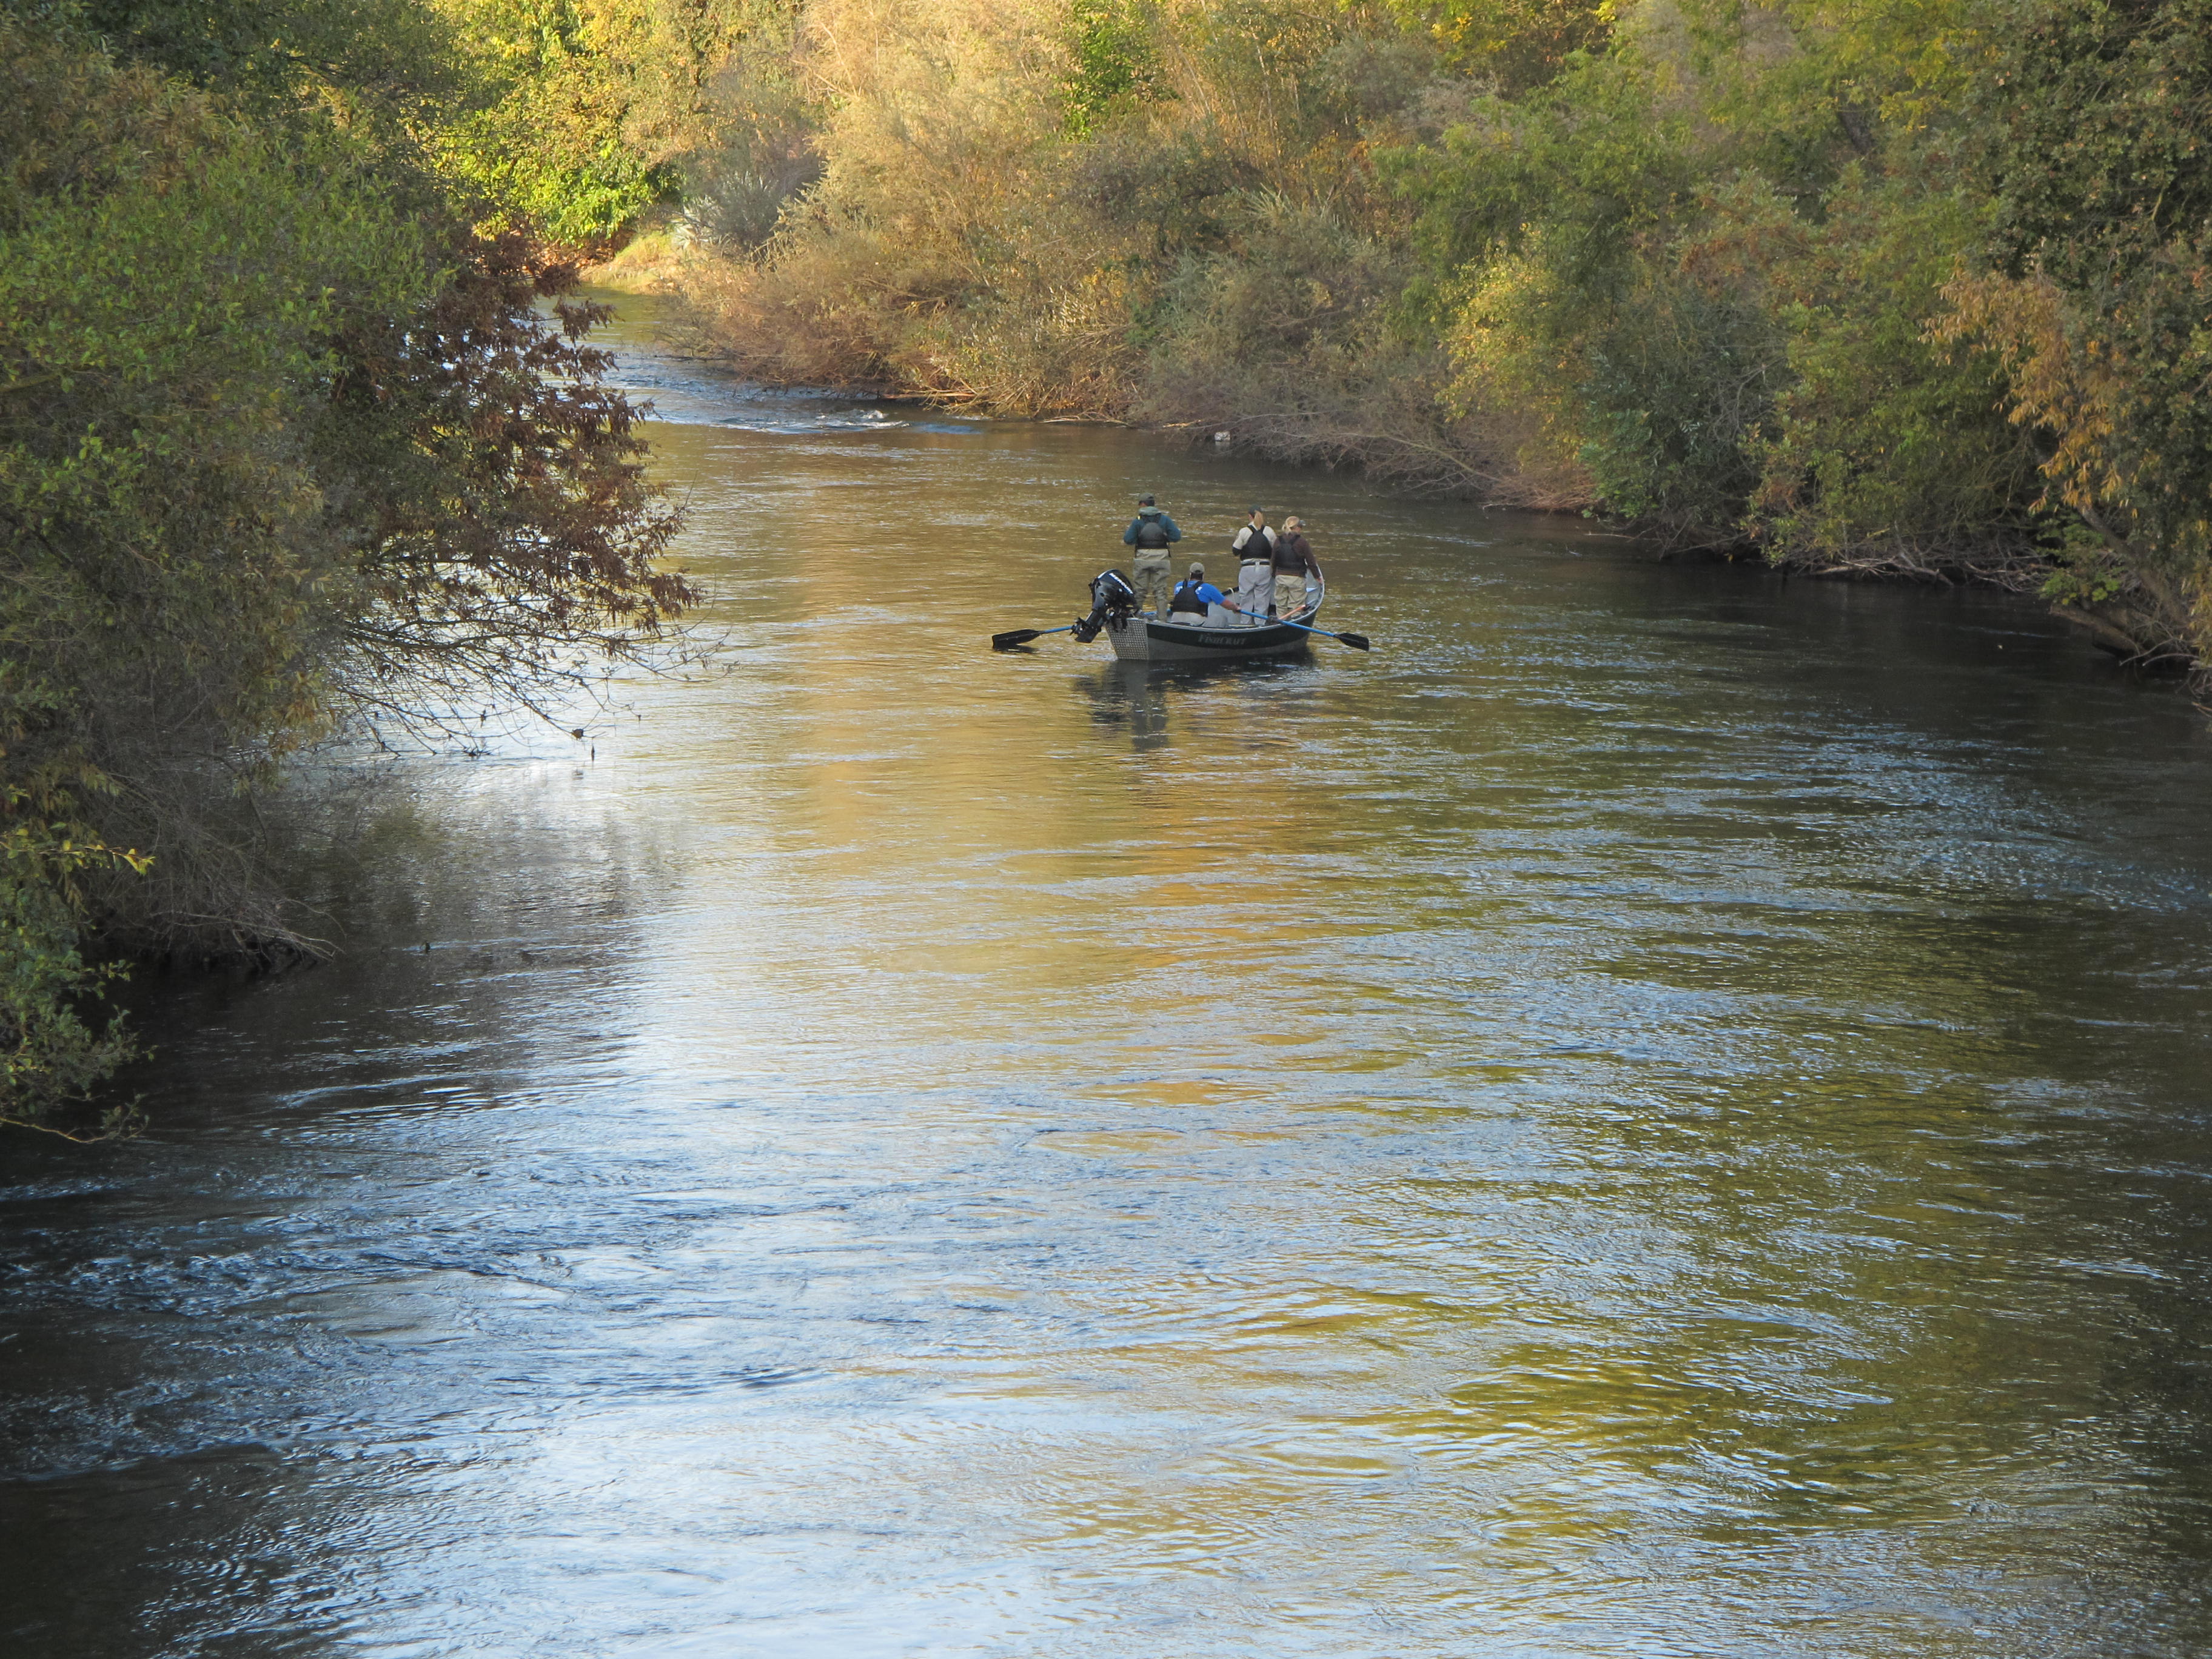 Annual carcass surveys conducted by CDFG continued through the week of October 24. The largest number of live fish was observed on the Merced River, with a peak live count thus far of 106 Chinook. Peak live counts on the Stanislaus and Tuolumne rivers were 78 and 71, respectively. High flows on the Stanislaus River have continued to make it difficult to survey. Annual carcass surveys conducted by CDFG continued through the week of October 24. The largest number of live fish was observed on the Merced River, with a peak live count thus far of 106 Chinook. Peak live counts on the Stanislaus and Tuolumne rivers were 78 and 71, respectively. High flows on the Stanislaus River have continued to make it difficult to survey.
Thirty-seven redds were observed on the Merced River, thirty-four on the Tuolumne River, and thirty-five were recorded on the Stanislaus River. A peak in the number of redds observed for the fall-run season typically occurs in mid- to late-November.
Seven females have been spawned at the Merced River Fish Facility (MRFF) as of October 30.
|
2011 Calaveras River Juvenile Migration Monitoring
The Calaveras River rotary screw trap at Shelton Road (RM 28) installed on October 26 to monitor migration before the pulse flow, scheduled to begin on October 31. The trap was operated four days between October 26 and October 30 and a total of eight O. mykiss were captured during the reporting period. Daily catches ranged from one to five individuals, and all O. mykiss captured were Age 1+ (100-299 mm) and were rated as silvery parr (n=8). Average forklengths and weights of O. mykiss are provided in Table 2.
No Chinook salmon were captured during this reporting period.
Instantaneous temperature recorded at the trap ranged from 52.2ºF to 56.1ºF, and turbidity ranged from 0.39 NTU to 0.75 NTU. During the reporting period, daily average combined flow from New Hogan Dam (NHG) and Cosgrove Creek (COS) fluctuated between 32 cfs and 84 cfs, and at Bellota (MRS) flow fluctuated between 7 cfs and 29 cfs (COS; Figure 7).
Table 2. Biosampling data for O. mykiss captured at Shelton Road between October 26 and October 30, 2011. Parenthesis indicates range.
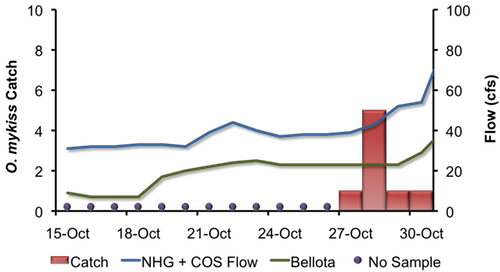
Figure 7. Daily O. mykiss catch at Shelton Road, and Calaveras River flow recorded by New Hogan Dam (NHG) and Cosgrove Creek (COS) combined and flow recorded at Bellota (MRS), in 2011.
|
2011 Stanislaus River Juvenile Migration Monitoring
 The Stanislaus River rotary screw trap at Oakdale (RM 40) operated continuously between October 17 and October 30. A variety of fish species were captured, including Sacramento sucker (n=14), bluegill (n=4), and prickly sculpin (n=3) (Table 3). The Stanislaus River rotary screw trap at Oakdale (RM 40) operated continuously between October 17 and October 30. A variety of fish species were captured, including Sacramento sucker (n=14), bluegill (n=4), and prickly sculpin (n=3) (Table 3).
No O. mykiss were captured during the reporting period. Season total remains at one.
Instantaneous temperature taken at the trap ranged from 51.8ºF to 55.6ºF, and turbidity ranged from 0.25 NTU to 2.08 NTU. Daily average flow at Goodwin Dam (GDW) ranged between 1,882 cfs and 2,233 cfs, and flows at Ripon (RIP) ranged between 2,080 cfs and 2,425 cfs.
Table 3. Biosampling data for all species captured and measured at Oakdale between October 17 and October 30, 2011.
|
San Joaquin River Conditions
During the reporting period, flow in the San Joaquin River at Vernalis was relatively stable, fluctuating from 4,280 cfs to 4,700 cfs (Figure 8). Water temperature in the San Joaquin River decreased from 62.5°F to 57.4°F at Vernalis, from 63.8°F to 58.4°F at Mossdale, and from 65.4°F to 60.6°F at Rough 'n Ready Island (Figure 9). Average daily dissolved oxygen (DO) in the San Joaquin River fluctuated from 8.8 mg/L to 9.6 mg/L at Mossdale, and from 8.1 mg/L to 8.5 mg/L in the deep-water ship channel (measured at Rough 'n Ready Island; Figure 10).
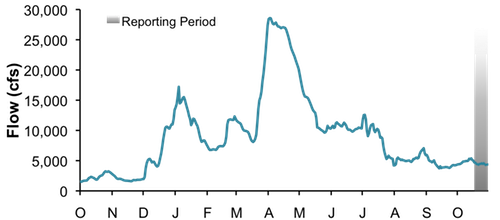
Figure 8. San Joaquin River flow at Vernalis from October 1, 2010, through October 30, 2011.
Figure 9. San Joaquin River daily average water temperature at Vernalis, Mossdale, and Rough 'n Ready from October 1, 2010, through October 30, 2011.

Figure 10. San Joaquin River daily average dissolved oxygen at Mossdale and Rough 'n Ready, from October 1, 2010, through October 30, 2011.
|
Delta Exports
Mean daily pumping at the C.W. Jones Pumping Plant (federal pumps previously known as Tracy Pumping Plant) ranged from 3,820 cfs to 4,114 cfs (Figure 11). Mean daily pumping at the Harvey O. Banks Pumping Plant (state pumps) ranged from 5,590 cfs to 8,083 cfs. Combined total exports (state and federal pumps) during this period ranged from 9,609 cfs to 11,903 cfs.
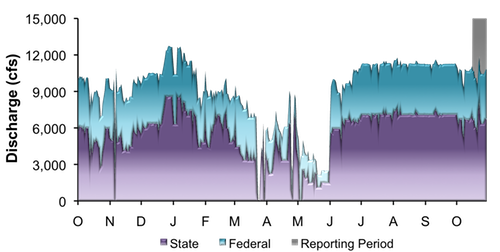
Figure 11. Daily exports at the state and federal pumping stations from October 1, 2010, through October 30, 2011.
|
|
|
|
|
|
|