| Volume 2011, Issue 3 | October 25, 2011 |
|

Stanislaus River Salmon Festival:
November 5
|
|
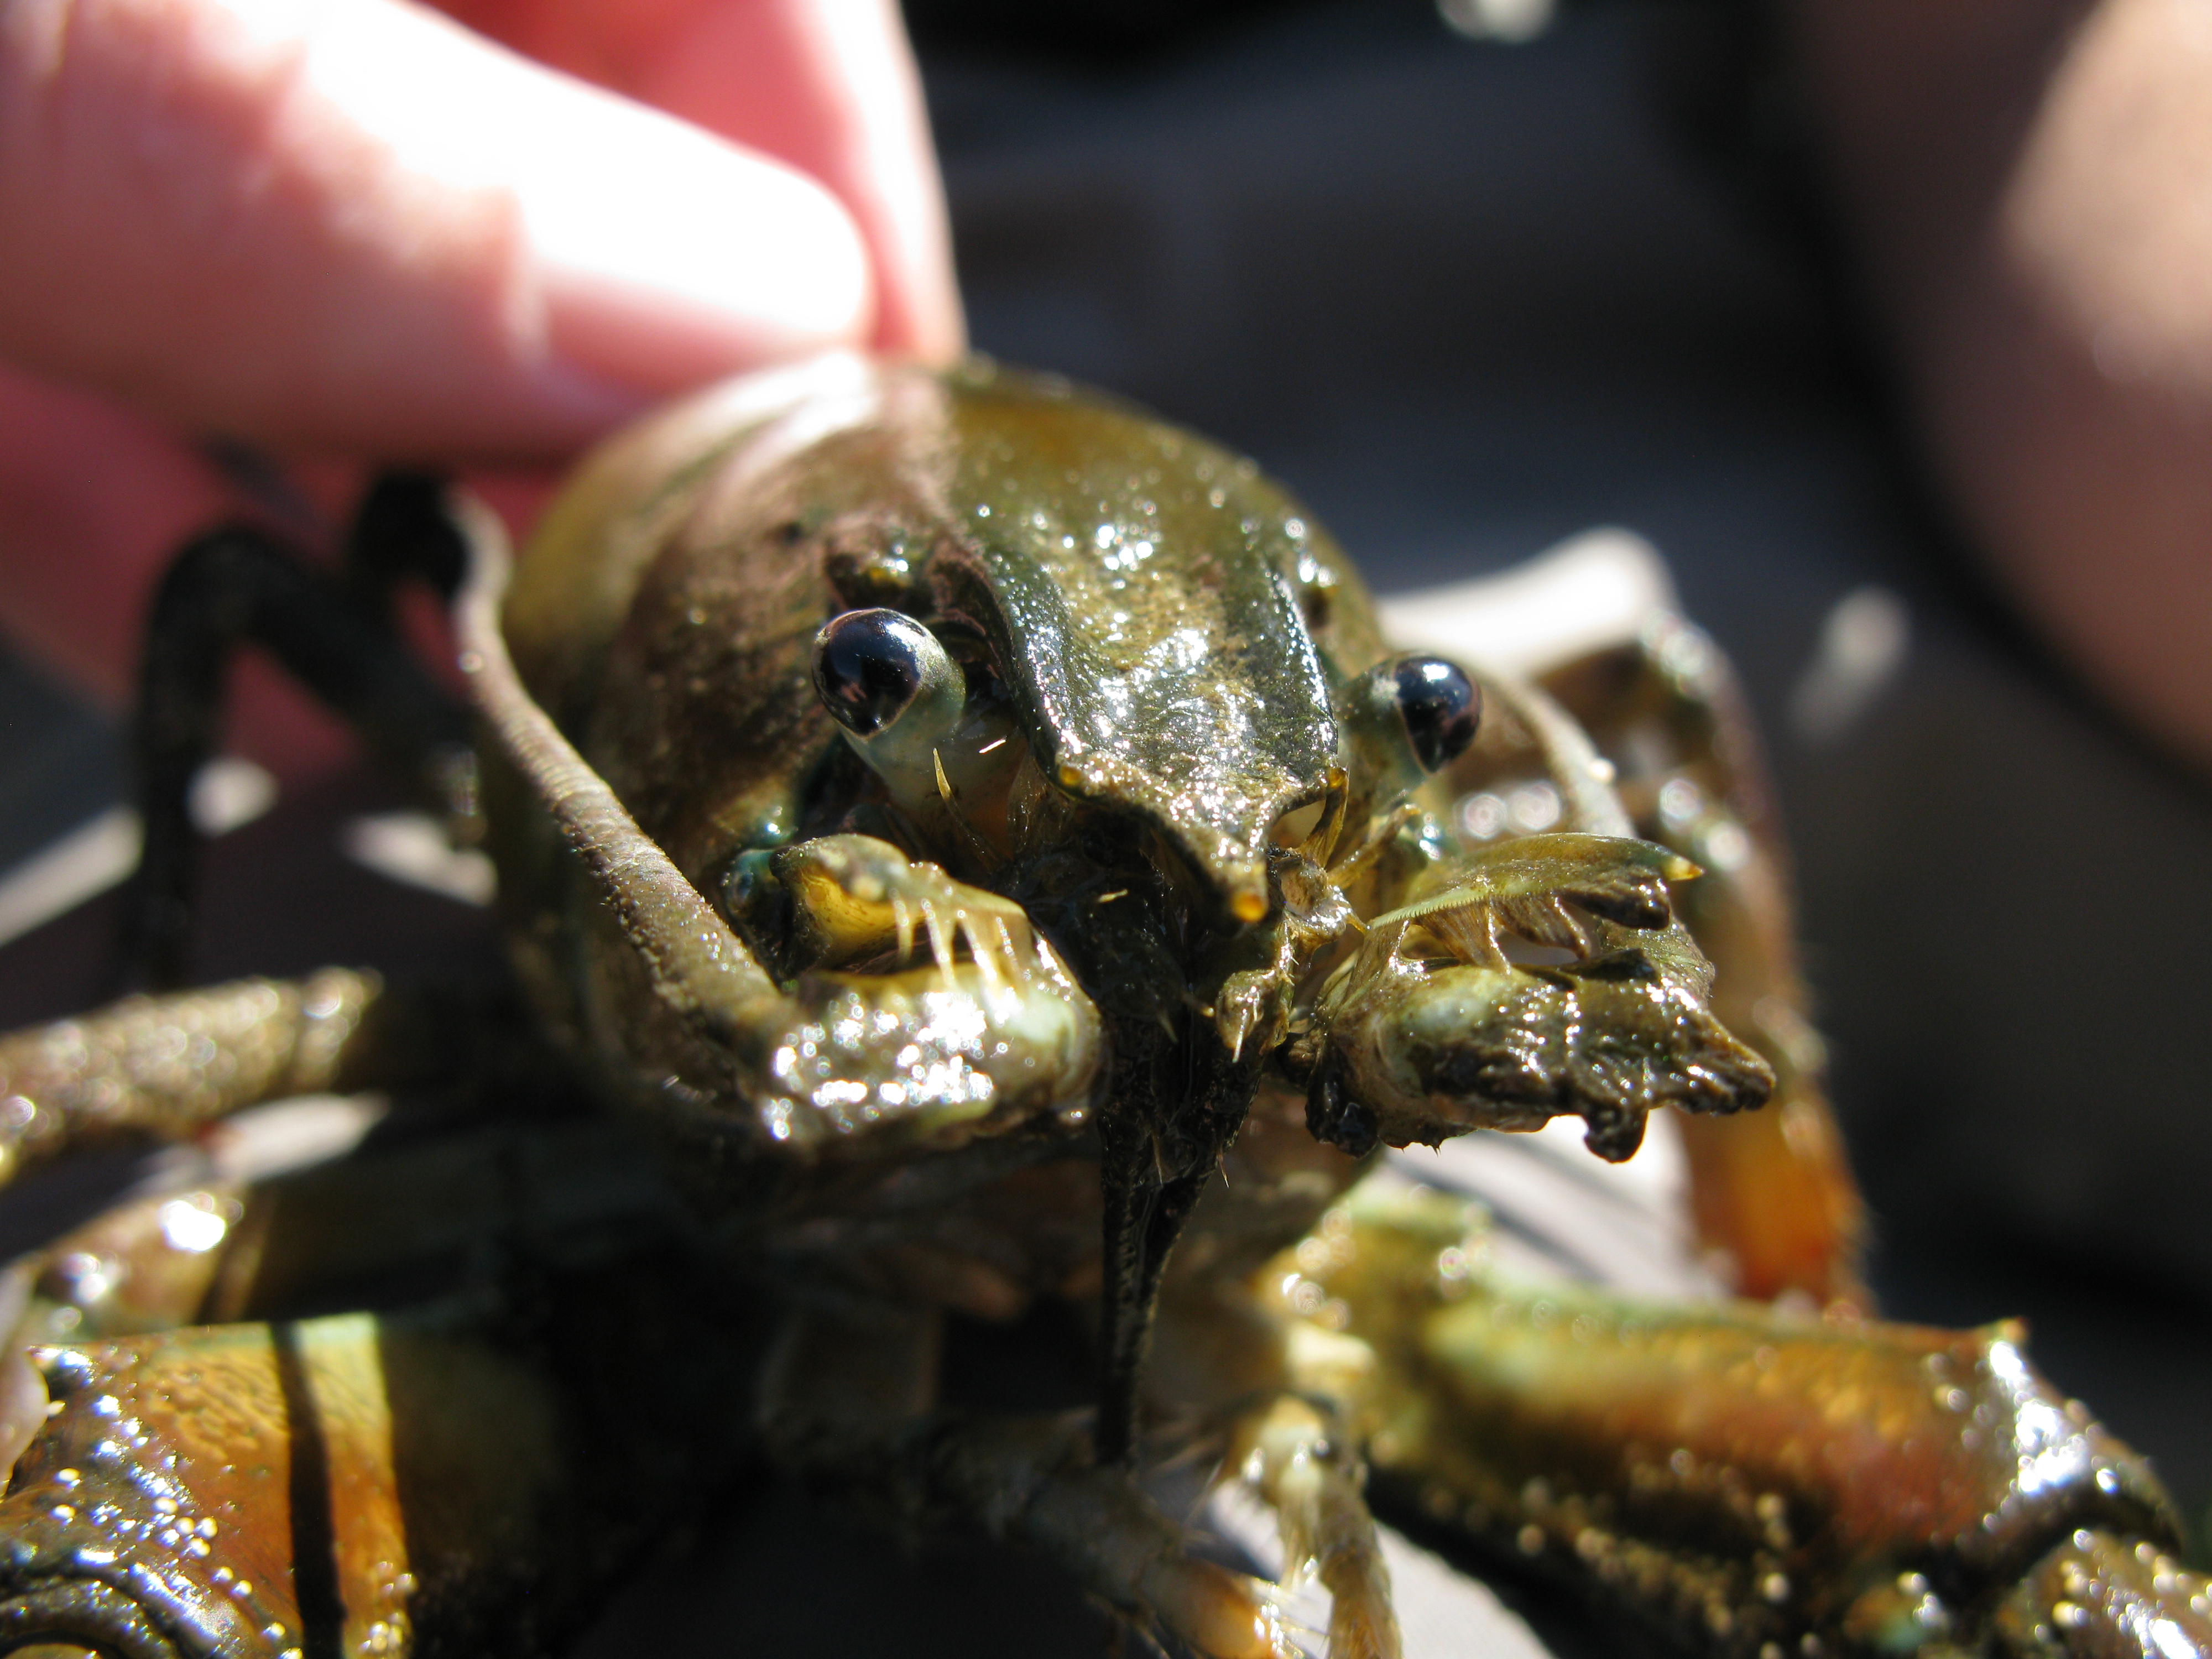
Photo by FISHBIO |
Key Highlights
October 3 - October 16, 2011
Stanislaus River Weir Monitoring continues to be delayed by high flow releases from New Melones Reservoir which are expected to continue through at least the end of October.
Tuolumne River Weir Monitoring continued during the reporting period. A total of 552 Chinook salmon passed upstream through the weir between October 3 and October 16, increasing the season total to 680.
Mokelumne River Woodbridge Dam Fish Ladder Monitoring continued during the reporting period and a total of 4,389 Chinook passed upstream of the dam between October 3 and October 16, increasing the season total to 5,112.
San Joaquin Basin Escapement Surveys. Annual carcass surveys conducted by California Department of Fish and Game (CDFG) started during the week of October 3.
Stanislaus River Juvenile Migration Monitoring at Oakdale (RM 40) was initiated immediately after the rotary screw trap was installed on October 5.
San Joaquin River Conditions San Joaquin River flow at Vernalis fluctuated from 4,432 cfs to 5,375 cfs. Water temperature in the San Joaquin River ranged from 58.5°F to 61.9°F at Vernalis, and from 59.7°F to 63.4°F at Mossdale. Average daily dissolved oxygen (DO) in the San Joaquin River ranged from 8.5 mg/L to 9.1 mg/L at Mossdale, and from 7.7 mg/L to 8.4 mg/L at Rough 'n Ready.
Delta Exports Combined total exports (state and federal pumps) fluctuated during the reporting period, ranging from 9,314 cfs to 11,075 cfs.
|
|
|
2011 Stanislaus River Weir Adult Migration Monitoring
Flows on the Stanislaus River have fluctuated between 2,165 cfs and 2,568 cfs at Goodwin Dam (GDW) and are expected to continue to do so through October. Installation of the Stanislaus River weir has been tentatively postponed to early November.
|
2011 Tuolumne River Weir Adult Migration Monitoring
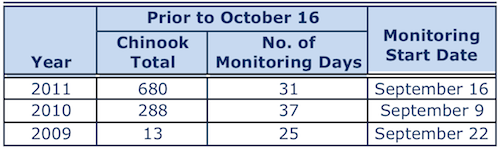
 Between October 3 and October 16 a total of 552 Chinook salmon were detected by the Vaki Riverwatcher as they passed upstream of the Tuolumne River weir, increasing the season total to 680 (Figure 1; Table 1). Daily passage ranged between 8 and 124 Chinook. Between October 3 and October 16 a total of 552 Chinook salmon were detected by the Vaki Riverwatcher as they passed upstream of the Tuolumne River weir, increasing the season total to 680 (Figure 1; Table 1). Daily passage ranged between 8 and 124 Chinook.
Daily average flow in the Tuolumne River ranged from 342 cfs to 1,190 cfs at La Grange (LGN; RM 50) and from 530 cfs to 1,230 cfs at Modesto (MOD; RM 17; Figure 2). Note: flows downstream of La Grange may be higher than dam releases due to accretion and Dry Creek inflow. Instantaneous water temperature measured at the weir ranged between 58.1˚F and 63.8˚F and daily average water temperature at Modesto ranged between 58.8˚F and 65.1˚F (Figure 3). Instantaneous turbidity ranged between 0.41 NTU and 2.42 NTU (Figure 4), and instantaneous dissolved oxygen ranged between 8.69 mg/L and 10.32 mg/L (Figure 5). Table 1. Annual Fall-run Chinook passage at the Tuolumne River Weir prior to October 16, 2009 - 2011.
Figure 1. Fall-Run Chinook salmon cumulative passage recorded at the Tuolumne River weir in 2009 - 2011. 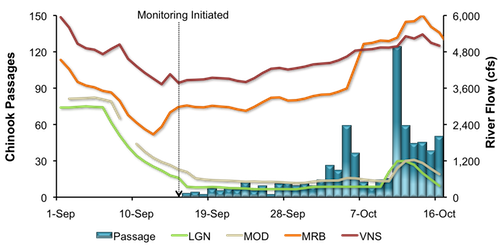
Figure 2. Daily upstream Chinook passage at the Tuolumne River Weir in relation to daily average flows (cfs) recorded in the Tuolumne River at La Grange (LGN) and Modesto (MOD), and in the San Joaquin River at Vernalis (VNS) in 2011. 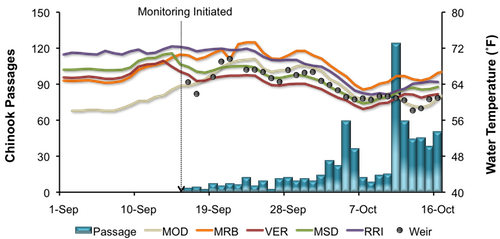
Figure 3. Daily upstream Chinook passage at the Tuolumne River Weir in relation to instantaneous water temperature recorded at the weir, and daily average water temperature recorded in the Tuolumne River at Modesto (MOD) and in the San Joaquin River at Vernalis (VER), Mossdale (MSD) and Rough & Ready (RRI) in 2011. 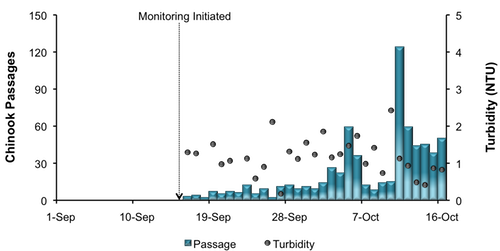
Figure 4. Daily upstream Chinook passage at the Tuolumne River Weir in relation to instantaneous turbidity recorded at the weir in 2011. 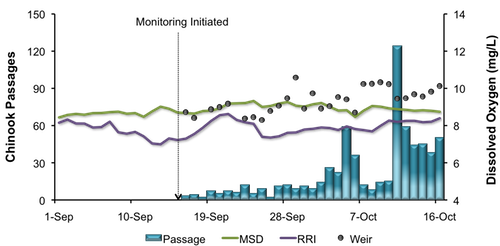
Figure 5. Daily upstream Chinook passage at the Tuolumne River Weir in relation to instantaneous dissolved oxygen recorded at the weir, and daily average dissolved oxygen recorded in the San Joaquin River at Mossdale (MSD) and Rough & Ready (RRI) in 2011.
|
Mokelumne River Woodbridge Dam Fish Ladder Monitoring Fall-run Chinook salmon returning to the Mokelumne River are counted annually by East Bay Municipal Utility District (EBMUD) as they ascend the fish ladder at Woodbridge Dam. During the reporting period 4,389 Chinook salmon were observed passing upstream of the dam, increasing the season total to 5,112 (Figure 6). Daily passage ranged between 149 and 683 Chinook. During the reporting period, daily average flow in the Mokelumne River fluctuated between 799 and 1,802 cfs at Camanche Reservoir (CMN). 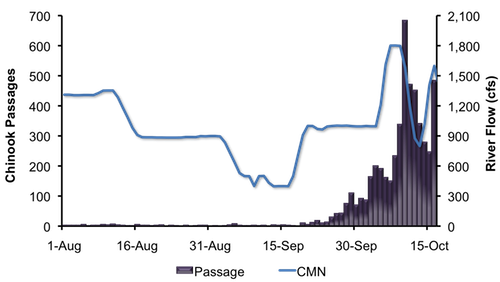
Figure 6. Daily upstream Chinook passage recorded at the Woodbridge Dam fish ladder in relation to daily average flows (cfs) recorded in the Mokelumne River at Camanche Reservoir (CMN), 2011.
|
San Joaquin Basin Escapement Surveys Annual carcass surveys conducted by CDFG started during the week of October 3. The largest number of live fish was observed on the Tuolumne River, with a peak live count thus far of sixteen Chinook. Peak live counts on the Stanislaus and Merced rivers were fourteen and nine, respectively. High flows on the Stanislaus River have made it difficult to survey this year. Five redds were observed on both the Merced and Tuolumne rivers each, and three redds were recorded on the Stanislaus River. Typically, a peak in the number of redds observed for the fall-run season occurs in mid- to late-November. No females have been spawned at the Merced River Fish Facility (MRFF) as of October 16.
|
2011 Stanislaus River Juvenile Migration Monitoring
 The Stanislaus River rotary screw trap at Oakdale (RM 40) was installed on October 5 and operated continuously through the end of the reporting period. A variety of fish species were captured, including Sacramento sucker (n=6), bluegill (n=6), and largemouth bass (n=4) (Table 2). The Stanislaus River rotary screw trap at Oakdale (RM 40) was installed on October 5 and operated continuously through the end of the reporting period. A variety of fish species were captured, including Sacramento sucker (n=6), bluegill (n=6), and largemouth bass (n=4) (Table 2).
One O. mykiss was also captured during the reporting period and rated as silvery parr.
Table 2. Biosampling data for all species captured and measured at Oakdale between October 5 and October 16, 2011.
Instantaneous temperature taken at the trap ranged from 51.4ºF to 57.8ºF, and turbidity ranged from 0.20 NTU to 1.86 NTU. Daily average flow at Goodwin Dam (GDW) ranged between 2,165 cfs and 2,568 cfs, and flows at Ripon (RIP) ranged between 2,127 cfs and 2,621 cfs.
|
San Joaquin River Conditions
During the reporting period, flow in the San Joaquin River at Vernalis fluctuated from 4,432 cfs to 5,375 cfs (Figure 7). Water temperature in the San Joaquin River ranged from 58.5°F to 61.9°F at Vernalis, from 59.7°F to 63.4°F at Mossdale, and from 61.7°F to 66.9°F at Rough 'n Ready Island (Figure 8). Average daily dissolved oxygen (DO) in the San Joaquin River fluctuated from 7.7 mg/L to 8.4 mg/L in the deep-water ship channel (measured at Rough 'n Ready Island), and from 8.5 mg/L to 9.1 mg/L at Mossdale (Figure 9).
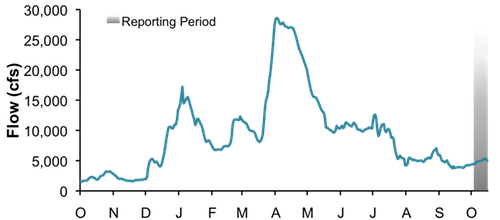
Figure 7. San Joaquin River flow at Vernalis from October 1, 2010, through October 16, 2011.
Figure 8. San Joaquin River daily average water temperature at Vernalis, Mossdale, and Rough 'n Ready from October 1, 2010, through October 16, 2011.
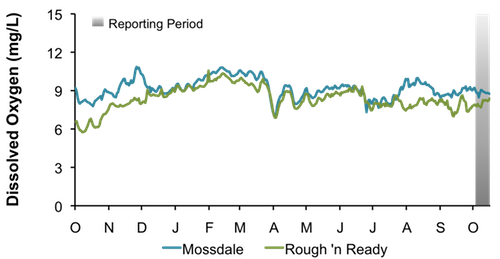
Figure 9. San Joaquin River daily average dissolved oxygen at Mossdale and Rough 'n Ready, from October 1, 2010, through October 16, 2011.
|
Delta Exports
Mean daily pumping at the C.W. Jones Pumping Plant (federal pumps previously known as Tracy Pumping Plant) ranged from 3,990 cfs to 4,164 cfs (Figure 10). Mean daily pumping at the Harvey O. Banks Pumping Plant (state pumps) ranged from 5,208 cfs to 7,038 cfs. Combined total exports (state and federal pumps) during this period ranged from 9,314 cfs to 11,075 cfs.
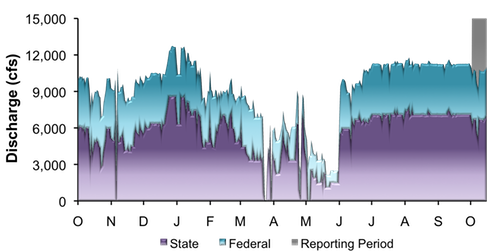
Figure 10. Daily exports at the state and federal pumping stations from October 1, 2010, through October 16, 2011.
|
|
|
|
|
|
|