| Volume 2011, Issue 2 | October 11, 2011 |
|

Stanislaus River Salmon Festival:
November 5
|
|
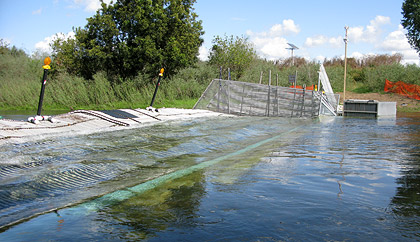
Photo by FISHBIO |
Key Highlights
September 19 - October 2, 2011
Stanislaus River Weir Monitoring continues to be delayed by high flow releases from New Melones Reservoir which are expected to continue through October.
Tuolumne River Weir Monitoring continued during the reporting period. A total of 119 Chinook salmon passed upstream through the weir between September 19 and October 2, increasing the season total to 128.
Mokelumne River Woodbridge Dam Fish Ladder Monitoring continued during the reporting period and a total of 613 Chinook passed upstream of the dam during the reporting period, increasing the season total to 723.
San Joaquin River Conditions San Joaquin River flow at Vernalis fluctuated from 3,802 cfs to 4,432 cfs. Water temperature in the San Joaquin River ranged from 62.9°F to 66.0°F at Vernalis, and from 64.7°F to 68.0°F at Mossdale. Average daily dissolved oxygen (DO) in the San Joaquin River ranged from 8.8 mg/L to 9.3 mg/L at Mossdale, and from 7.4 mg/L to 8.6 mg/L at Rough 'n Ready.
Delta Exports Combined total exports (state and federal pumps) fluctuated during the reporting period, ranging from 10,891 cfs to 11,283 cfs.
|
|
|
2011 Stanislaus River Weir Adult Migration Monitoring
Flows on the Stanislaus River were increased to 2,600 cfs on October 1 and are expected to remain high through October. Installation of the Stanislaus River weir has been tentatively postponed to early November.
|
2011 Tuolumne River Weir Adult Migration Monitoring
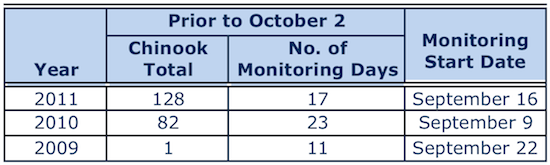
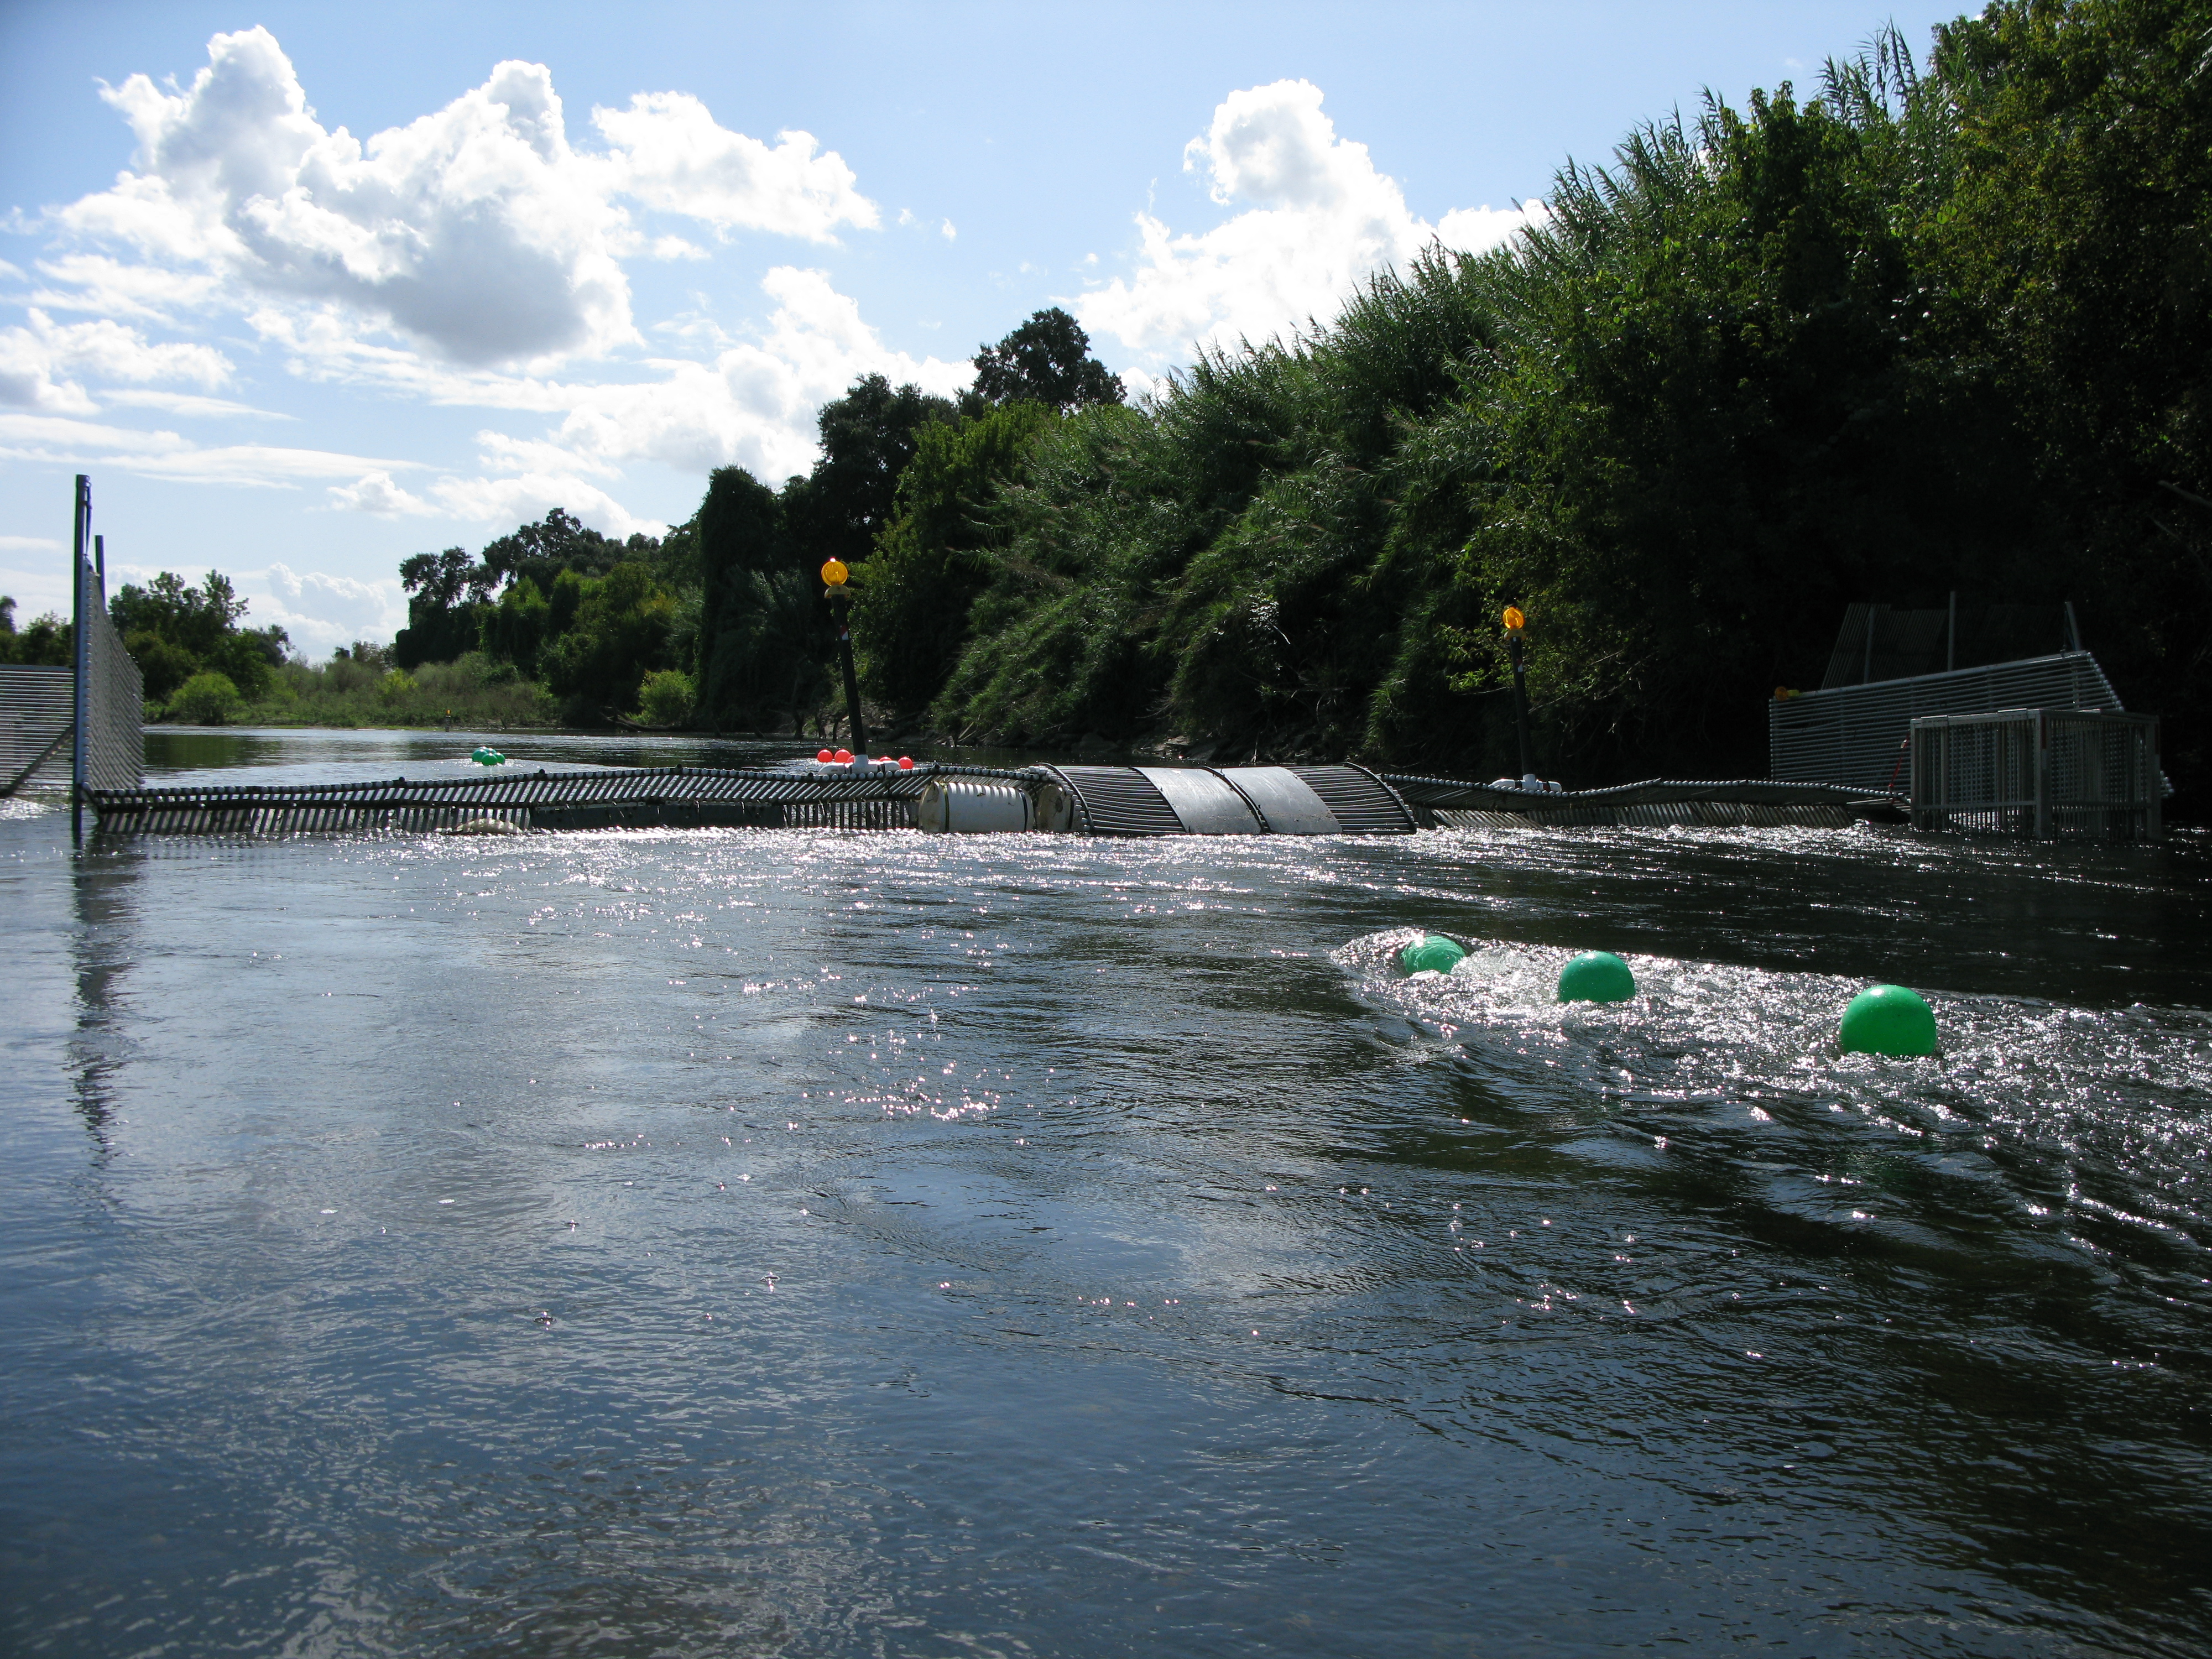 Between September 19 and October 2 a total of 119 Chinook salmon were detected by the Vaki Riverwatcher as they passed upstream of the Tuolumne River weir, increasing the season total to 128 (Figure 1). Daily passage ranged between 2 and 14 Chinook. While monitoring began a week later this year relative to 2010, the number observed so far in 2011 exceeds the annual count as of the same date in 2010 (Table 1). Between September 19 and October 2 a total of 119 Chinook salmon were detected by the Vaki Riverwatcher as they passed upstream of the Tuolumne River weir, increasing the season total to 128 (Figure 1). Daily passage ranged between 2 and 14 Chinook. While monitoring began a week later this year relative to 2010, the number observed so far in 2011 exceeds the annual count as of the same date in 2010 (Table 1).

Daily average flow in the Tuolumne River ranged from 264 cfs to 342 cfs at La Grange (LGN; RM 50) and from 465 cfs to 562 cfs at Modesto (MOD; RM 17) (Figure 2). Note: flows downstream of La Grange may be higher than dam releases due to accretion and Dry Creek inflow. Instantaneous water temperature measured at the weir ranged between 64.5˚F and 69.6˚F and daily average water temperature at Modesto (MOD; RM 17) ranged between 66.4˚F and 69.6˚F (Figure 3). Instantaneous turbidity ranged between 0.17 NTU and 2.11 NTU (Figure 4), and instantaneous dissolved oxygen ranged between 8.29 mg/L and 10.57 mg/L (Figure 5). Table 1. Annual Fall-run Chinook passage at the Tuolumne River Weir prior to October 2, 2009 - 2011.
Figure 1. Fall-Run Chinook salmon cumulative passage recorded at the Tuolumne River weir in 2009 - 2011.
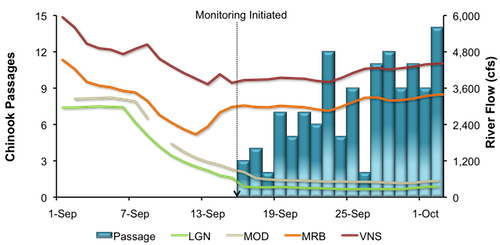
Figure 2. Daily upstream Chinook passage at the Tuolumne River Weir in relation to daily average flows (cfs) recorded in the Tuolumne River at La Grange (LGN) and Modesto (MOD), and in the San Joaquin River at Vernalis (VNS) in 2011.
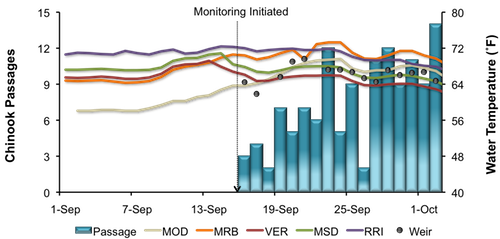
Figure 3. Daily upstream Chinook passage at the Tuolumne River Weir in relation to instantaneous water temperature recorded at the weir, and daily average water temperature recorded in the Tuolumne River at Modesto (MOD) and in the San Joaquin River at Vernalis (VER), Mossdale (MSD) and Rough & Ready (RRI) in 2011.
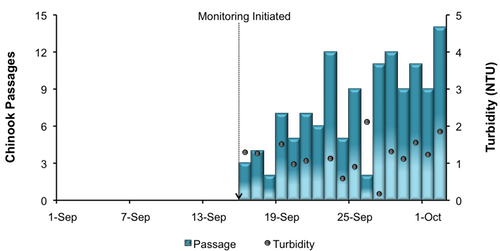
Figure 4. Daily upstream Chinook passage at the Tuolumne River Weir in relation to instantaneous turbidity recorded at the weir in 2011.
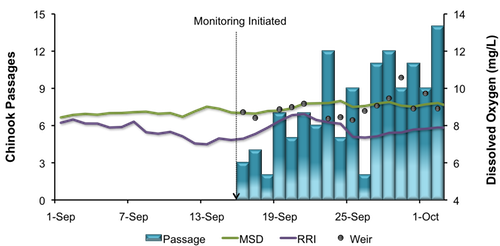
Figure 5. Daily upstream Chinook passage at the Tuolumne River Weir in relation to instantaneous dissolved oxygen recorded at the weir, and daily average dissolved oxygen recorded in the San Joaquin River at Mossdale (MSD) and Rough & Ready (RRI) in 2011.
|
Mokelumne River Woodbridge Dam Fish Ladder Monitoring Fall-run Chinook salmon returning to the Mokelumne are counted annually by East Bay Municipal Utility District (EBMUD) as they ascend the fish ladder at Woodbridge Dam. During the reporting period 613 Chinook salmon were observed passing upstream of the dam, increasing the season total to 723 (Figure 6). Daily passage ranged between 5 and 109 Chinook. During the reporting period, daily average flow in the Mokelumne River fluctuated between 908 and 1,003 cfs at Camanche Reservoir (CMN). 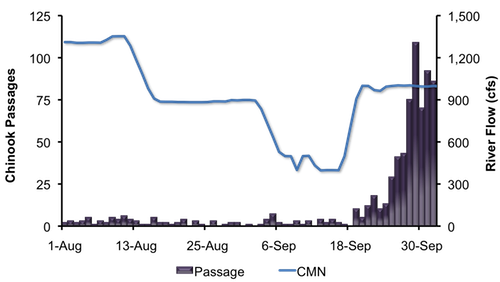
Figure 6. Daily upstream Chinook passage recorded at the Woodbridge Dam fish ladder in relation to daily average flows (cfs) recorded in the Mokelumne River at Camanche Reservoir (CMN), 2011.
|
San Joaquin River Conditions
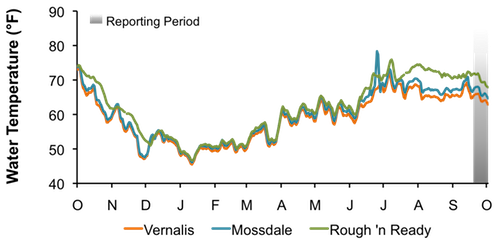
During the reporting period, flow in the San Joaquin River at Vernalis fluctuated from 3,802 cfs to 4,432 cfs (Figure 7). Water temperature in the San Joaquin River ranged from 62.9°F to 66.0°F at Vernalis, from 64.7°F to 68.0°F at Mossdale, and from 67.9°F to 71.9°F at Rough 'n Ready Island (Figure 8). Average daily dissolved oxygen (DO) in the San Joaquin River fluctuated from 7.4 mg/L to 8.6 mg/L in the deep-water ship channel (measured at Rough 'n Ready Island), and from 8.8 mg/L to 9.3 mg/L at Mossdale (Figure 9).
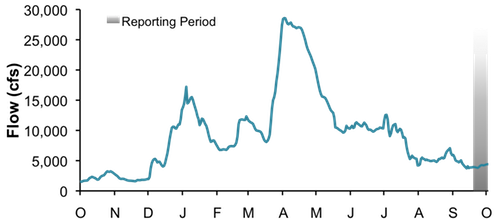
Figure 7. San Joaquin River flow at Vernalis from October 1, 2010, through October 2, 2011.
Figure 8. San Joaquin River daily average water temperature at Vernalis, Mossdale, and Rough 'n Ready from October 1, 2010, through October 2, 2011.
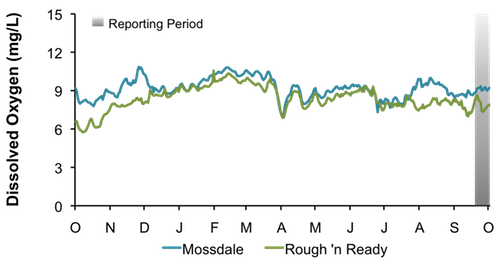
Figure 9. San Joaquin River daily average dissolved oxygen at Mossdale and Rough 'n Ready, from October 1, 2010, through October 2, 2011.
|
Delta Exports
Mean daily pumping at the C.W. Jones Pumping Plant (federal pumps previously known as Tracy Pumping Plant) ranged from 4,013 cfs to 4,188 cfs (Figure 10). Mean daily pumping at the Harvey O. Banks Pumping Plant (state pumps) ranged from 6,719 cfs to 7,095 cfs. Combined total exports (state and federal pumps) during this period ranged from 10,891 cfs to 11,283 cfs.
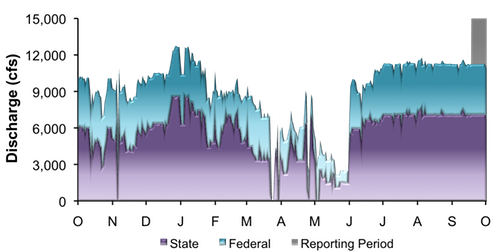
Figure 10. Daily exports at the state and federal pumping stations from October 1, 2010, through October 2, 2011.
|
|
|
|
|
|
|
Come and see what's going on at FISHBIO.com and follow us on   
Also, sign up and get the latest news and information with our email newsletter.
Data Disclaimer: The data displayed on the FISHBIO website are courtesy of California Department of Fish & Game (CDFG), U.S. Fish & Wildlife Service (USFWS), Tri-dam, Turlock Irrigation District (TID), Modesto Irrigation District (MID), East Bay Municipal Utility District (EBMUD) and FISHBIO. Data are intended to be current, but are preliminary and are not guaranteed to be accurate. Source data compiled and provided by FISHBIO, from whom further information can be obtained. Use or reproduction of this data is prohibited without prior permission.
|
|