| Volume 2011, Issue 1 | September 28, 2011 |
|

Salmon Festival:
November 5
|
|
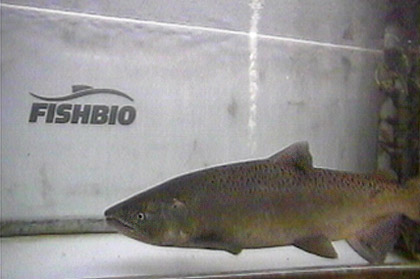
Photo by FISHBIO |
Key Highlights
August 17 - September 18, 2011
Stanislaus River Weir Monitoring has been delayed by high flow releases from New Melones Reservoir which are expected to continue until mid-October.
Tuolumne River Weir Monitoring began immediately after installation was completed on September 16, 2011. A total of nine Chinook salmon were detected as they passed upstream of the weir between September 16 and September 18.
Mokelumne River Woodbridge Dam Fish Ladder Monitoring continued during the reporting period and a total of 60 Chinook passed upstream of the dam during this period, increasing the season total to 110.
San Joaquin River Conditions San Joaquin River flow at Vernalis fluctuated from 3,729 cfs to 7,056 cfs. Water temperature in the San Joaquin River ranged from 63.9°F to 69.2°F at Vernalis, and from 65.7°F to 70.9°F at Mossdale. Average daily dissolved oxygen (DO) in the San Joaquin River ranged from 8.4 mg/L to 9.7 mg/L at Mossdale, and from 7.0 mg/L to 8.4 mg/L at Rough 'n Ready.
Delta Exports Combined total exports (state and federal pumps) fluctuated during the reporting period, ranging from 10,805 cfs to 11,605 cfs.
|
|
2011 Stanislaus River Weir Adult Migration Monitoring
Stanislaus River weir monitoring has been delayed by high flow releases from New Melones Reservoir which are expected to continue until mid-October. The weir will be installed as soon as flow conditions permit.
|
2011 Tuolumne River Weir Adult Migration Monitoring
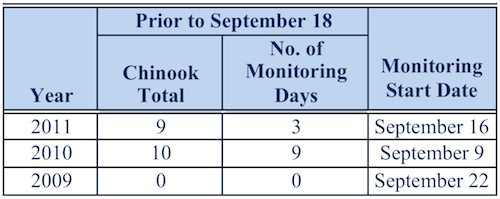
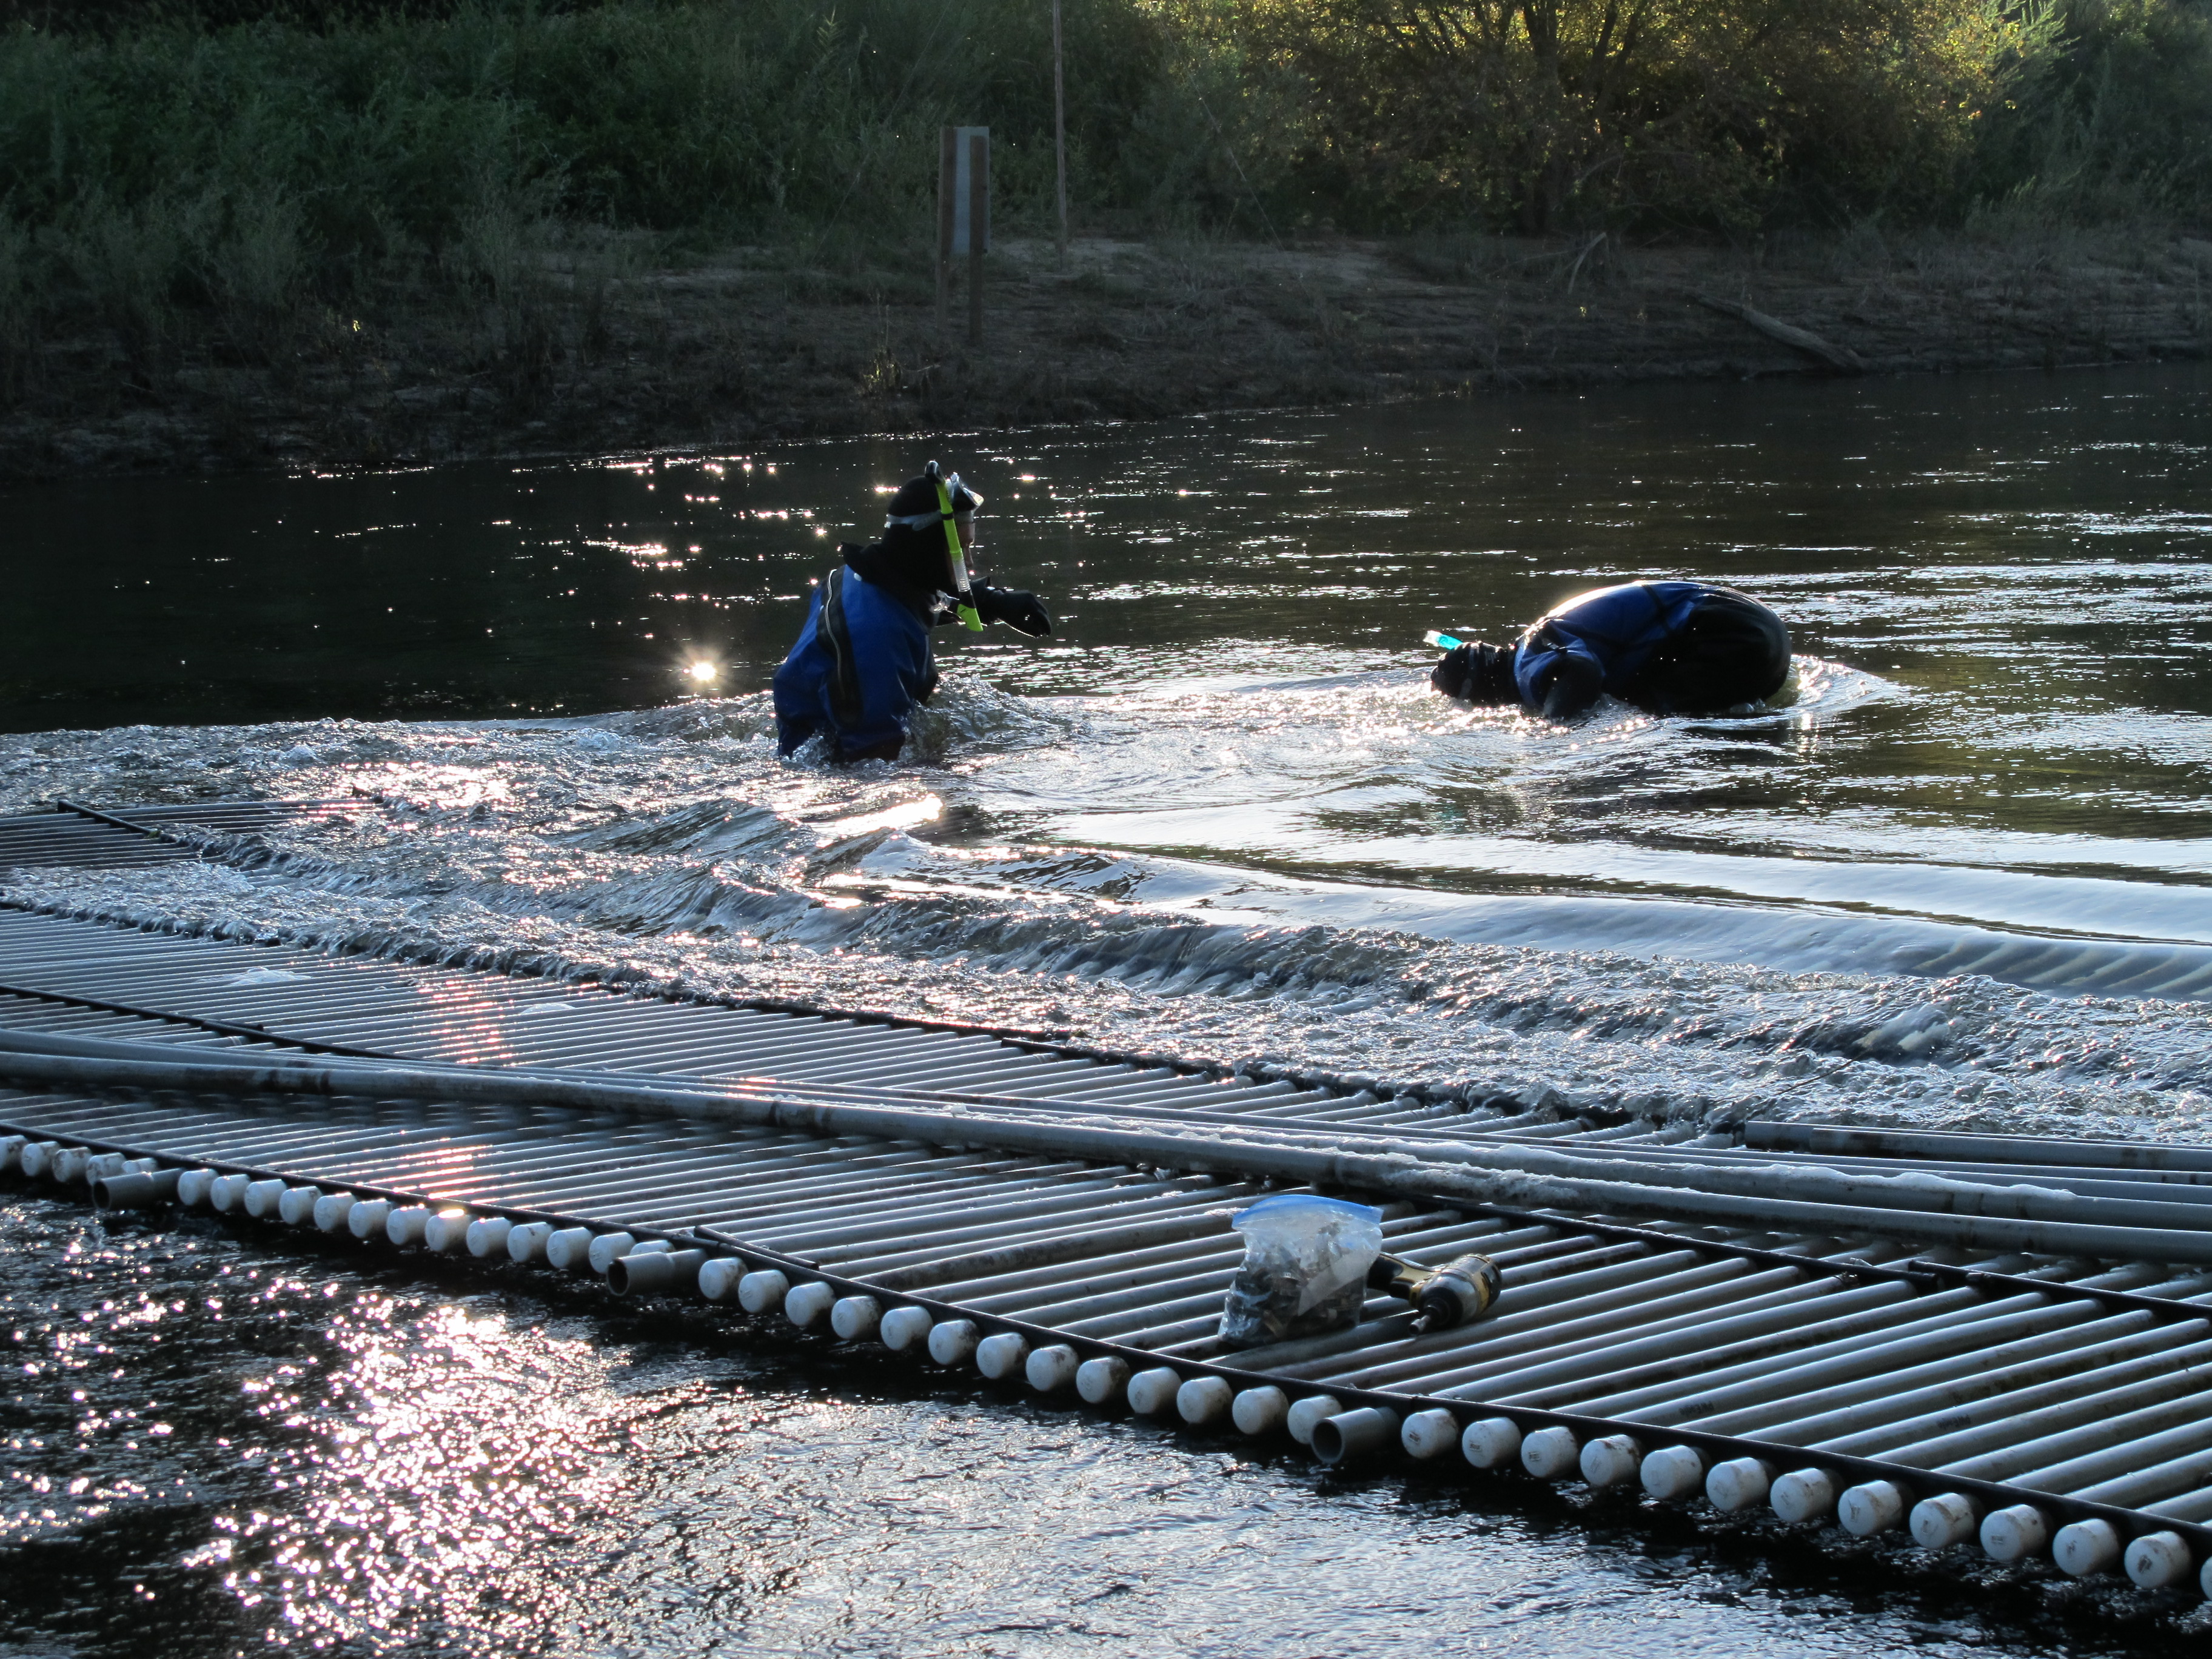 Monitoring at the Tuolumne River Weir, downstream of Fox Grove Fishing Access (RM 24), began immediately after installation was completed on September 16 and is expected to continue through the fall-run Chinook salmon adult migration season. A total of nine Chinook salmon were detected by the Vaki Riverwatcher as they passed upstream through the weir between September 16 and 18 (Table 1). Daily passage ranged between two and four Chinook salmon. Monitoring at the Tuolumne River Weir, downstream of Fox Grove Fishing Access (RM 24), began immediately after installation was completed on September 16 and is expected to continue through the fall-run Chinook salmon adult migration season. A total of nine Chinook salmon were detected by the Vaki Riverwatcher as they passed upstream through the weir between September 16 and 18 (Table 1). Daily passage ranged between two and four Chinook salmon.
 Daily average flow in the Tuolumne River decreased from 3,000 cfs and 325 cfs at La Grange (LGN; RM 50) and from 3,290 cfs to 585 cfs at Modesto (MOD; RM 17) (Figure 1). Note: flows downstream of La Grange may be higher than dam releases due to accretion and Dry Creek inflow. Daily average flow in the Tuolumne River decreased from 3,000 cfs and 325 cfs at La Grange (LGN; RM 50) and from 3,290 cfs to 585 cfs at Modesto (MOD; RM 17) (Figure 1). Note: flows downstream of La Grange may be higher than dam releases due to accretion and Dry Creek inflow.
Instantaneous water temperature measured at the weir ranged between 61.8˚F and 69.0˚F and daily average water temperature at Modesto (MOD; RM 17) ranged between 58.1˚F and 65.1˚F (Figure 2). Instantaneous turbidity ranged between 0.97 NTU and 1.51 NTU (Figure 3), and instantaneous dissolved oxygen ranged between 8.40 mg/L and 8.99 mg/L (Figure 4).
Table 1. Annual Fall-run Chinook passage prior to September 18, 2009 - 2011.

Figure 1. Daily upstream Chinook passage at the Tuolumne River Weir in relation to daily average flows (cfs) recorded in the Tuolumne River at La Grange (LGN) and Modesto (MOD), and in the San Joaquin River at Vernalis (VNS) in 2011.
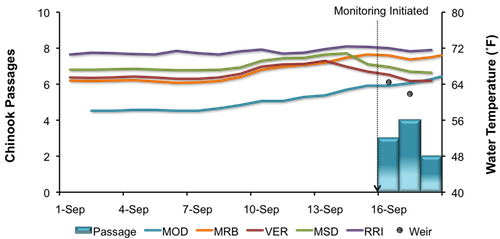
Figure 2. Daily upstream Chinook passage at the Tuolumne River Weir in relation to instantaneous water temperature recorded at the weir, and daily average water temperature recorded in the Tuolumne River at Modesto (MOD) and in the San Joaquin River at Vernalis (VER), Mossdale (MSD) and Rough & Ready (RRI) in 2011.
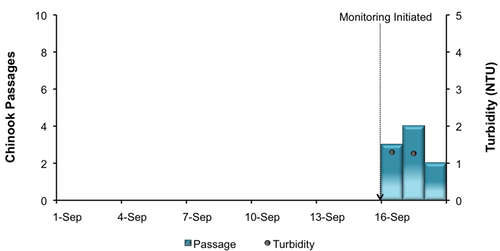
Figure 3. Daily upstream Chinook passage at the Tuolumne River Weir in relation to instantaneous turbidity recorded at the weir in 2011.
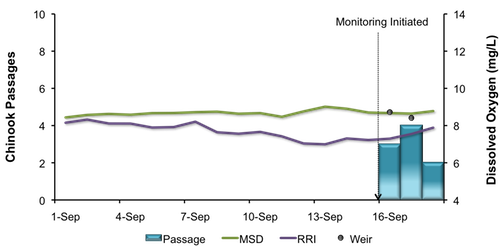
Figure 4. Daily upstream Chinook passage at the Tuolumne River Weir in relation to instantaneous dissolved oxygen recorded at the weir, and daily average dissolved oxygen recorded in the San Joaquin River at Mossdale (MSD) and Rough & Ready (RRI) in 2011.
|
Mokelumne River Woodbridge Dam Fish Ladder Monitoring Fall-run Chinook salmon returning to the Mokelumne are counted annually by East Bay Municipal Utility District (EBMUD) as they ascend the fish ladder at Woodbridge Dam. During the reporting period 60 Chinook salmon were observed passing upstream of the dam, increasing the season total to 110 (Figure 5). Last fall, escapement to the Mokelumne River was higher than in recent years (n=7,196), and the Pacific Fishery Management Council's Sacramento Index forecast for 2011 predicts that the recent trend in increasing escapement of Central Valley Chinook salmon fall-run will continue. Daily average releases to the Mokelumne River from Camanche Reservoir (CMN) ranged from 397 cfs to 899 cfs during the reporting period. 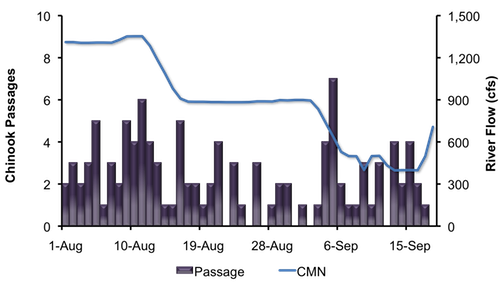
Figure 5. Daily upstream Chinook passage recorded at the Woodbridge Dam fish ladder in relation to daily average flows (cfs) recorded in the Mokelumne River at Camanche Reservoir (CMN), 2011.
|
San Joaquin River Conditions
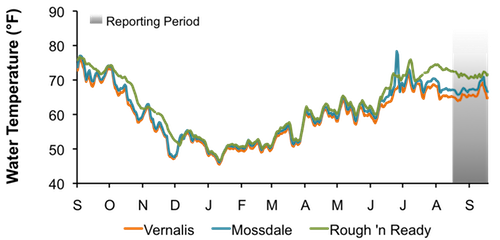
During the reporting period, flow in the San Joaquin River at Vernalis ranged from 3,729 cfs to 7,056 cfs (Figure 6). Water temperature in the San Joaquin River ranged from 63.9°F to 69.2°F at Vernalis, from 65.7°F to 70.9°F at Mossdale, and from 70.4°F to 72.6°F at Rough 'n Ready Island (Figure 7). Average daily dissolved oxygen (DO) in the San Joaquin River fluctuated from 7.0 mg/L to 8.4 mg/L in the deep-water ship channel (measured at Rough 'n Ready Island), and from 8.4 mg/L to 9.7 mg/L at Mossdale (Figure 8).
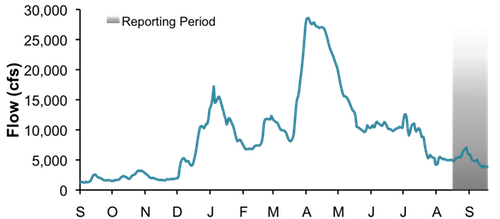
Figure 6. San Joaquin River flow at Vernalis from September 1, 2010, through September 18, 2011.
Figure 7. San Joaquin River daily average water temperature at Vernalis, Mossdale, and Rough 'n Ready from September 1, 2010, through September 18, 2011.
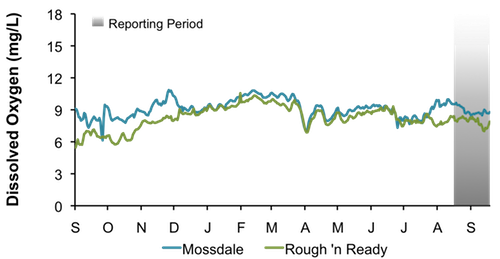
Figure 8. San Joaquin River daily average dissolved oxygen at Mossdale and Rough 'n Ready, from September 1, 2010, through September 18, 2011.
|
Delta Exports
Mean daily pumping at the C.W. Jones Pumping Plant (federal pumps previously known as Tracy Pumping Plant) fluctuated between 3,739 cfs and 4,215 cfs (Figure 9). Mean daily pumping at the Harvey O. Banks Pumping Plant (state pumps) ranged from 7,010 cfs to 7,451 cfs. Combined total exports (state and federal pumps) during this period ranged from 10,805 cfs to 11,605 cfs.
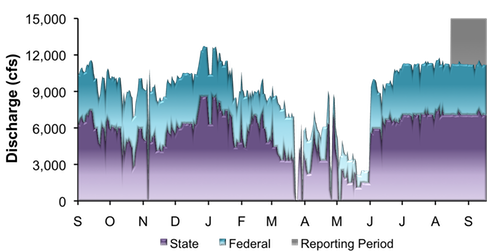
Figure 9. Daily exports at the state and federal pumping stations from September 1, 2010, through September 18, 2011.
|
|
|
|
|
|
|
Come and see what's going on at FISHBIO.com and follow us on   
Also, sign up and get the latest news and information with our email newsletter.
Data Disclaimer: The data displayed on the FISHBIO website are courtesy of California Department of Fish & Game (CDFG), U.S. Fish & Wildlife Service (USFWS), Tri-dam, Turlock Irrigation District (TID), Modesto Irrigation District (MID), East Bay Municipal Utility District (EBMUD) and FISHBIO. Data are intended to be current, but are preliminary and are not guaranteed to be accurate. Source data compiled and provided by FISHBIO, from whom further information can be obtained. Use or reproduction of this data is prohibited without prior permission.
|
|