| Volume 2010/11, Issue 17 | September 6, 2011 |
|

National AFS Conference:
September 4-8
Calaveras Barriers Project Groundbreaking:
September 7
Teaming Up for the Tuolumne:
September 17
State of the San Francisco Estuary Conference:
September 20-21
|
|

Photo by FISHBIO |
Key Highlights
July 19 - August 16, 2011
Juvenile Migration Monitoring wrapped up for the season at all sites in the San Joaquin Basin during mid June to mid July (Table 1).
Stanislaus River Weir and Tuolumne River Weir Monitoring are expected to in early October and mid-September, respectively, when lower flows are anticipated.
Table 1. Total salmonid catch by site during the 2010/11 San Joaquin Basin juvenile migration monitoring period.

Mokelumne River Woodbridge Dam Fish Ladder Monitoring began on August 1 and a total of 50 Chinook passed upstream of the dam during the reporting period.
San Joaquin River Conditions. San Joaquin River flow at Vernalis fluctuated from 4,208 cfs to 8,873 cfs. Water temperature in the San Joaquin River ranged from 64.4°F to 68.7°F at Vernalis, and from 66.3°F to 70.4°F at Mossdale. Average daily dissolved oxygen (DO) in the San Joaquin River ranged from 8.3 mg/L to 10.0 mg/L at Mossdale, and from 7.4 mg/L to 8.6 mg/L at Rough 'n Ready.
Delta Exports. Combined total exports (state and federal pumps) fluctuated during the reporting period, ranging from 10,834 cfs to 11,770 cfs.
|
|
2010/11 Calaveras River Juvenile Migration Monitoring
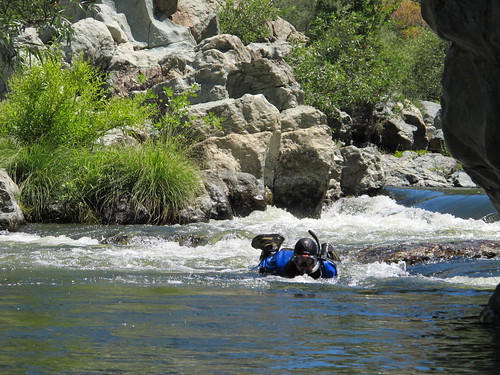 | |
Calaveras River snorkel survey
|
Monitoring at Shelton Road (RM 28) ended for the season on July 15. During the 2010/11 season, the trap was operated 128 days between November 1 and July 15. Due to high flows (>300 cfs) the trap was operated for only one day between February 26 and April 6. A total of 735 O. mykiss were captured during the season. Most of the O. mykiss captured (n=417) were Age 1+ (100-299 mm), but there were also many (n=147) YOY (<100 mm). Average forklengths and weights are provided in Table 2 for the O. mykiss that were measured.
No Chinook salmon were captured during the 2010/11 monitoring season.
Daily average combined flow from New Hogan Dam (NHG) and Cosgrove Creek (COS) fluctuated during the reporting period between 195 cfs and 308 cfs, and at Bellota (MRS) flow fluctuated between 47 cfs and 212 cfs (Figure 2).
Table 2. Biosampling data for O. mykiss captured at Shelton Road between November 1, 2010 and July 15, 2011. Parentheses indicate range.


Figure 2. Daily O. mykiss catch at Shelton Road, Calaveras River flow recorded at New Hogan Dam (NHG) and Cosgrove Creek (COS) combined, and flow recorded at Bellota (MRS), between November 1, 2010 and August 16, 2011.
|
2011 Stanislaus River Juvenile Migration Monitoring
Rotary screw trap monitoring at Oakdale (RM 40) ended for the season on June 30.
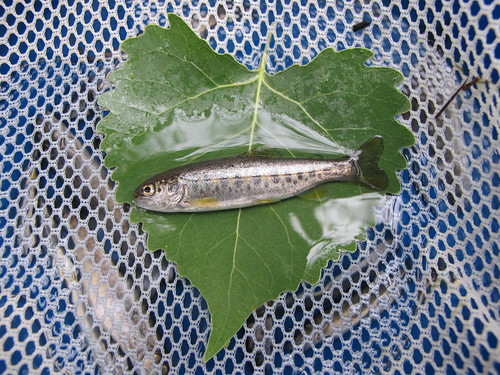 | |
Figure 3. O. mykiss captured at the Stanislaus River rotary screw trap at Oakdale.
|
Based on total catch of 43,335 juvenile Chinook salmon and the results of eighteen trap efficiency experiments conducted during 2011, an estimated 374,227 juvenile Chinook salmon passed downstream of the Stanislaus River rotary screw trap at Oakdale during the 2011 monitoring season. Average forklengths and weights of all measured Chinook salmon are provided in Table 3.
A total of 21 O. mykiss were captured during the 2011 monitoring season (Figure 3).
Daily average flow at Goodwin Dam (GDW) fluctuated during the reporting period ranging between 1,883 cfs and 2,549 cfs, and flow at Ripon (RIP) ranged from 1,907 cfs to 2,470 cfs (Figure 4).
Table 3. Biosampling data for Chinook salmon and O. mykiss captured and measured at Oakdale between January 4, 2010 and June 30, 2011.


Figure 4. Daily Chinook salmon catch at Oakdale, and Stanislaus River flow recorded at Goodwin Dam (GDW) and Ripon (RIP) in 2011.
A total of 599 juvenile Chinook salmon and 2 O. mykiss were captured in the Stanislaus River rotary screw trap at Caswell during the 2010/11 monitoring season.
Daily average flow at at Ripon (RIP) fluctuated during the reporting period ranging between 1,907 cfs to 2,470 cfs (Figure 5).

Figure 5. Daily Chinook salmon catch at Caswell, and Stanislaus River flow recorded at Ripon (RIP) in 2010/11.
|
2010/11 Tuolumne River Juvenile Migration Monitoring Rotary screw trap monitoring at Waterford (RM 30) ended for the season on June 30. Based on total catch of 4,394 juvenile Chinook salmon and the results of four trap efficiency experiments conducted during 2010/11, an estimated 420,971 juvenile Chinook salmon passed downstream of the Tuolumne River rotary screw trap at Waterford during the 2010/11 monitoring season. Average forklengths and weights of all measured Chinook salmon are provided in Table 4. No O. mykiss were captured during the 2010/11 monitoring season. Daily average flow at La Grange (LGN) fluctuated from 641 cfs to 3,760 cfs during the reporting period (Figure 6). Table 4. Biosampling data for Chinook salmon captured and measured at Waterford between December 1, 2010 and June 30, 2011. Parentheses indicate range. 

Figure 6. Daily Chinook salmon catch at Waterford, and Tuolumne River flow recorded at La Grange (LGN) and Modesto (MOD) between December 1, 2010, and August 16, 2011.
Rotary screw trap monitoring at Grayson (RM 5) ended for the season on June 30. Based on total catch of 1,645 juvenile Chinook salmon and the results of five trap efficiency experiments conducted during 2011, an estimated 230,198 juvenile Chinook salmon passed downstream of the Tuolumne River rotary screw trap at Grayson during the 2011 monitoring season. Average forklengths and weights of all measured Chinook salmon are provided in Table 5.
No O. mykiss were captured during the 2011 monitoring season.
Daily average flow at Modesto (MOD) fluctuated from 961 cfs to 4,440 cfs (Figure 7).
Table 5. Biosampling data for Chinook salmon captured and measured at Grayson between January 5 and June 30, 2011. Parentheses indicate range.


Figure 7. Daily Chinook salmon catch at Grayson, and Tuolumne River flow recorded at La Grange (LGN) and Modesto (MOD) between January 1 and August 16, 2011.
|
2010/11 Mokelumne River Juvenile Migration Monitoring
The Mokelumne River rotary screw trap monitoring at Golf (RM 38) ended on July 19. A total of 3,923 juvenile Chinook salmon were captured during the 2011 monitoring season.
Average daily flow at Woodbridge Dam (WBR) decreased during the reporting period ranging from 1,015 cfs to 650 cfs (Figure 8).
A total of 188 O. mykiss were captured during the 2011 monitoring season.

Figure 8. Daily juvenile Chinook catches at Golf and Mokelumne River flow recorded at Woodbridge Dam (WBR), between January 1 and August 16, 2011.
|
2011 San Joaquin River Juvenile Migration Monitoring
The California Department of Fish and Game concluded intensive Kodiak Trawling at Mossdale targeting salmon smolts emigrating from the Stanislaus, Tuolumne, and Merced Rivers on June 29. The U.S. Fish and Wildlife Service will operate the trawl on a less frequent schedule until next spring.
|
2011 Stanislaus River Weir Adult Migration Monitoring
Flows on the Stanislaus River are scheduled to remain at 2,000 cfs through the end of September. The Stanislaus River weir is tentatively scheduled to be installed during the first week of October when flows are reduced to a point at which
sufficiently to allow installation and monitoring of adult Chinook salmon migration.
|
2011 Tuolumne River Weir Adult Migration Monitoring
Flows on the Tuolumne River are scheduled to remain at 2,000 cfs through the beginning of September. The Tuolumne River weir is tentatively scheduled to be installed during mid-September when flows are reduced sufficiently to allow installation and monitoring of adult Chinook salmon migration. |
Mokelumne River Woodbridge Dam Fish Ladder Monitoring
Fall-run Chinook salmon returning to the Mokelumne River are counted annually by East Bay Municipal Utility District (EBMUD) as they ascend the fish ladder at Woodbridge Dam. Monitoring began on August 1, and a total of 50 Chinook salmon have been counted so far this season (Figure 9).

Figure 9. Daily upstream Chinook passage recorded at the Woodbridge Dam fish ladder in relation to daily average flows (cfs) recorded in the Mokelumne River at Camanche Reservoir (CMN), 2011.
|
San Joaquin River ConditionsDuring the reporting period, flow in the San Joaquin River at Vernalis fluctuated from 4,208 cfs to 8,873 cfs (Figure 10). Water temperature in the San Joaquin River ranged from 64.4°F to 68.7°F at Vernalis, from 66.3°F to 70.4°F at Mossdale, and from 69.1°F to 75.9°F at Rough 'n Ready Island (Figure 11). Average daily dissolved oxygen (DO) in the San Joaquin River fluctuated from 7.4 mg/L to 8.6 mg/L in the deep-water ship channel (measured at Rough 'n Ready Island), and from 8.3 mg/L to 10.0 mg/L at Mossdale (Figure 12). 
Figure 10. San Joaquin River flow at Vernalis from August 1, 2010, through August 16, 2011.
Figure 11. San Joaquin River daily average water temperature at Vernalis, Mossdale, and Rough 'n Ready from August 1, 2010, through August 16, 2011.

Figure 12. San Joaquin River daily average dissolved oxygen at Mossdale and Rough 'n Ready, from August 1, 2010, through August 16, 2011.
|
Delta Exports
Mean daily pumping at the C.W. Jones Pumping Plant (federal pumps previously known as Tracy Pumping Plant) ranged from 3,849 cfs to 4,214 cfs (Figure 13). Mean daily pumping at the Harvey O. Banks Pumping Plant (state pumps) ranged from 6,639 cfs to 7,611 cfs. Combined total exports (state and federal pumps) during this period ranged from 10,834 cfs to 11,770 cfs.

Figure 13. Daily exports at the state and federal pumping stations from August 1, 2010, through August 16, 2011.
|
|
|
|
|
|
|


